Getting Started with Proxyman
This tutorial is going to demonstrate how we can use Proxyman to intercept HTTPS Traffic from your macOS devices.
This blog will cover the following:
- How to setup Proxyman on macOS
- How to capture HTTP/HTTPS Traffic from macOS with Proxyman
- How to use some debugging tools, such as Repeat, Edit & Repeat, Map Local, Map Remote, Breakpoint, etc.
1. Download Proxyman
First of all, we must download the latest Proxyman at https://proxyman.com or update directly from your current version by navigating to "Proxyman -> Check for Update…"
2. Install Proxyman Helper Tool
As soon as you start the Proxyman, Proxyman would:
- Automatically override your HTTP/HTTPS Proxy in System Network Preference. It's super convenient for you since you can see the traffic immediately without doing anything.
- Prompt to install Proxyman Helper Tool.
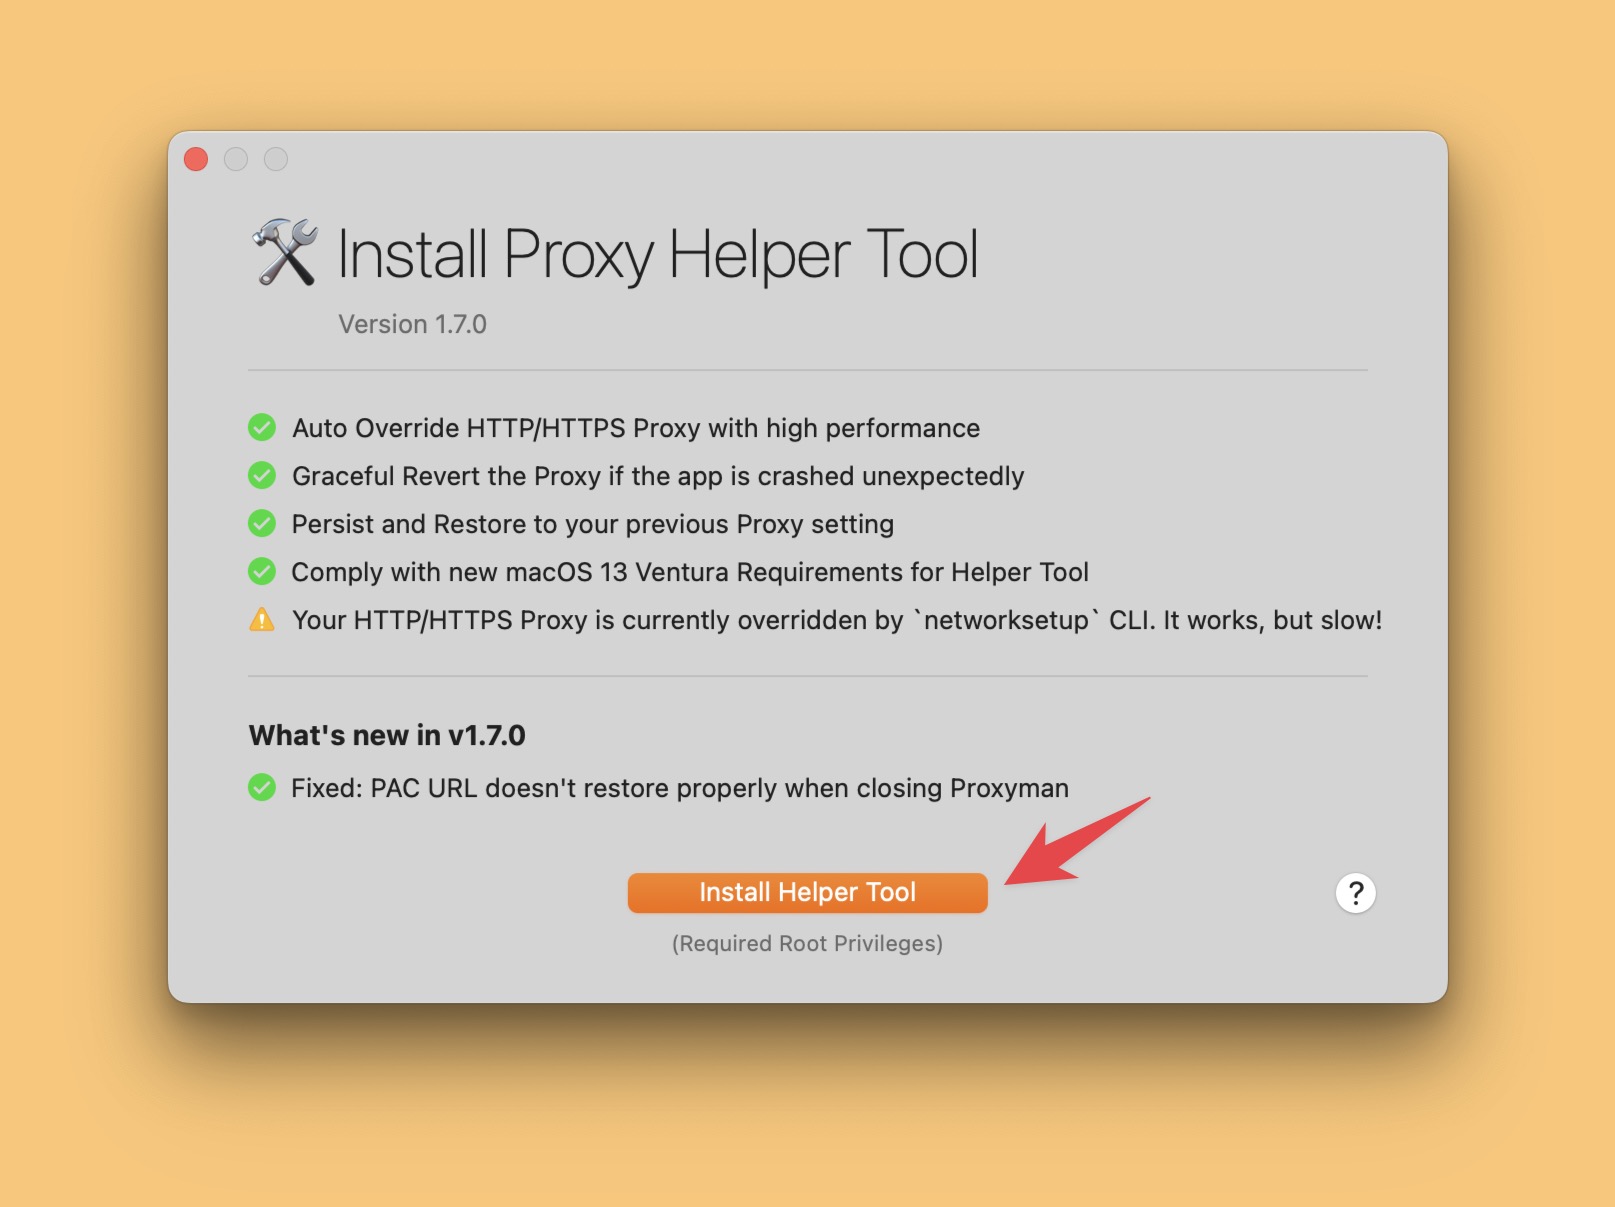
We highly recommend you install the Helper Tools because you can gain the following features for free:
- Automatically override HTTP/HTTPS Proxy with high performance. You can notice the bottleneck when opening Proxyman for the first time.
- Gracefully revert the HTTP/HTTPS Proxy if the app is unexpectedly crashed.
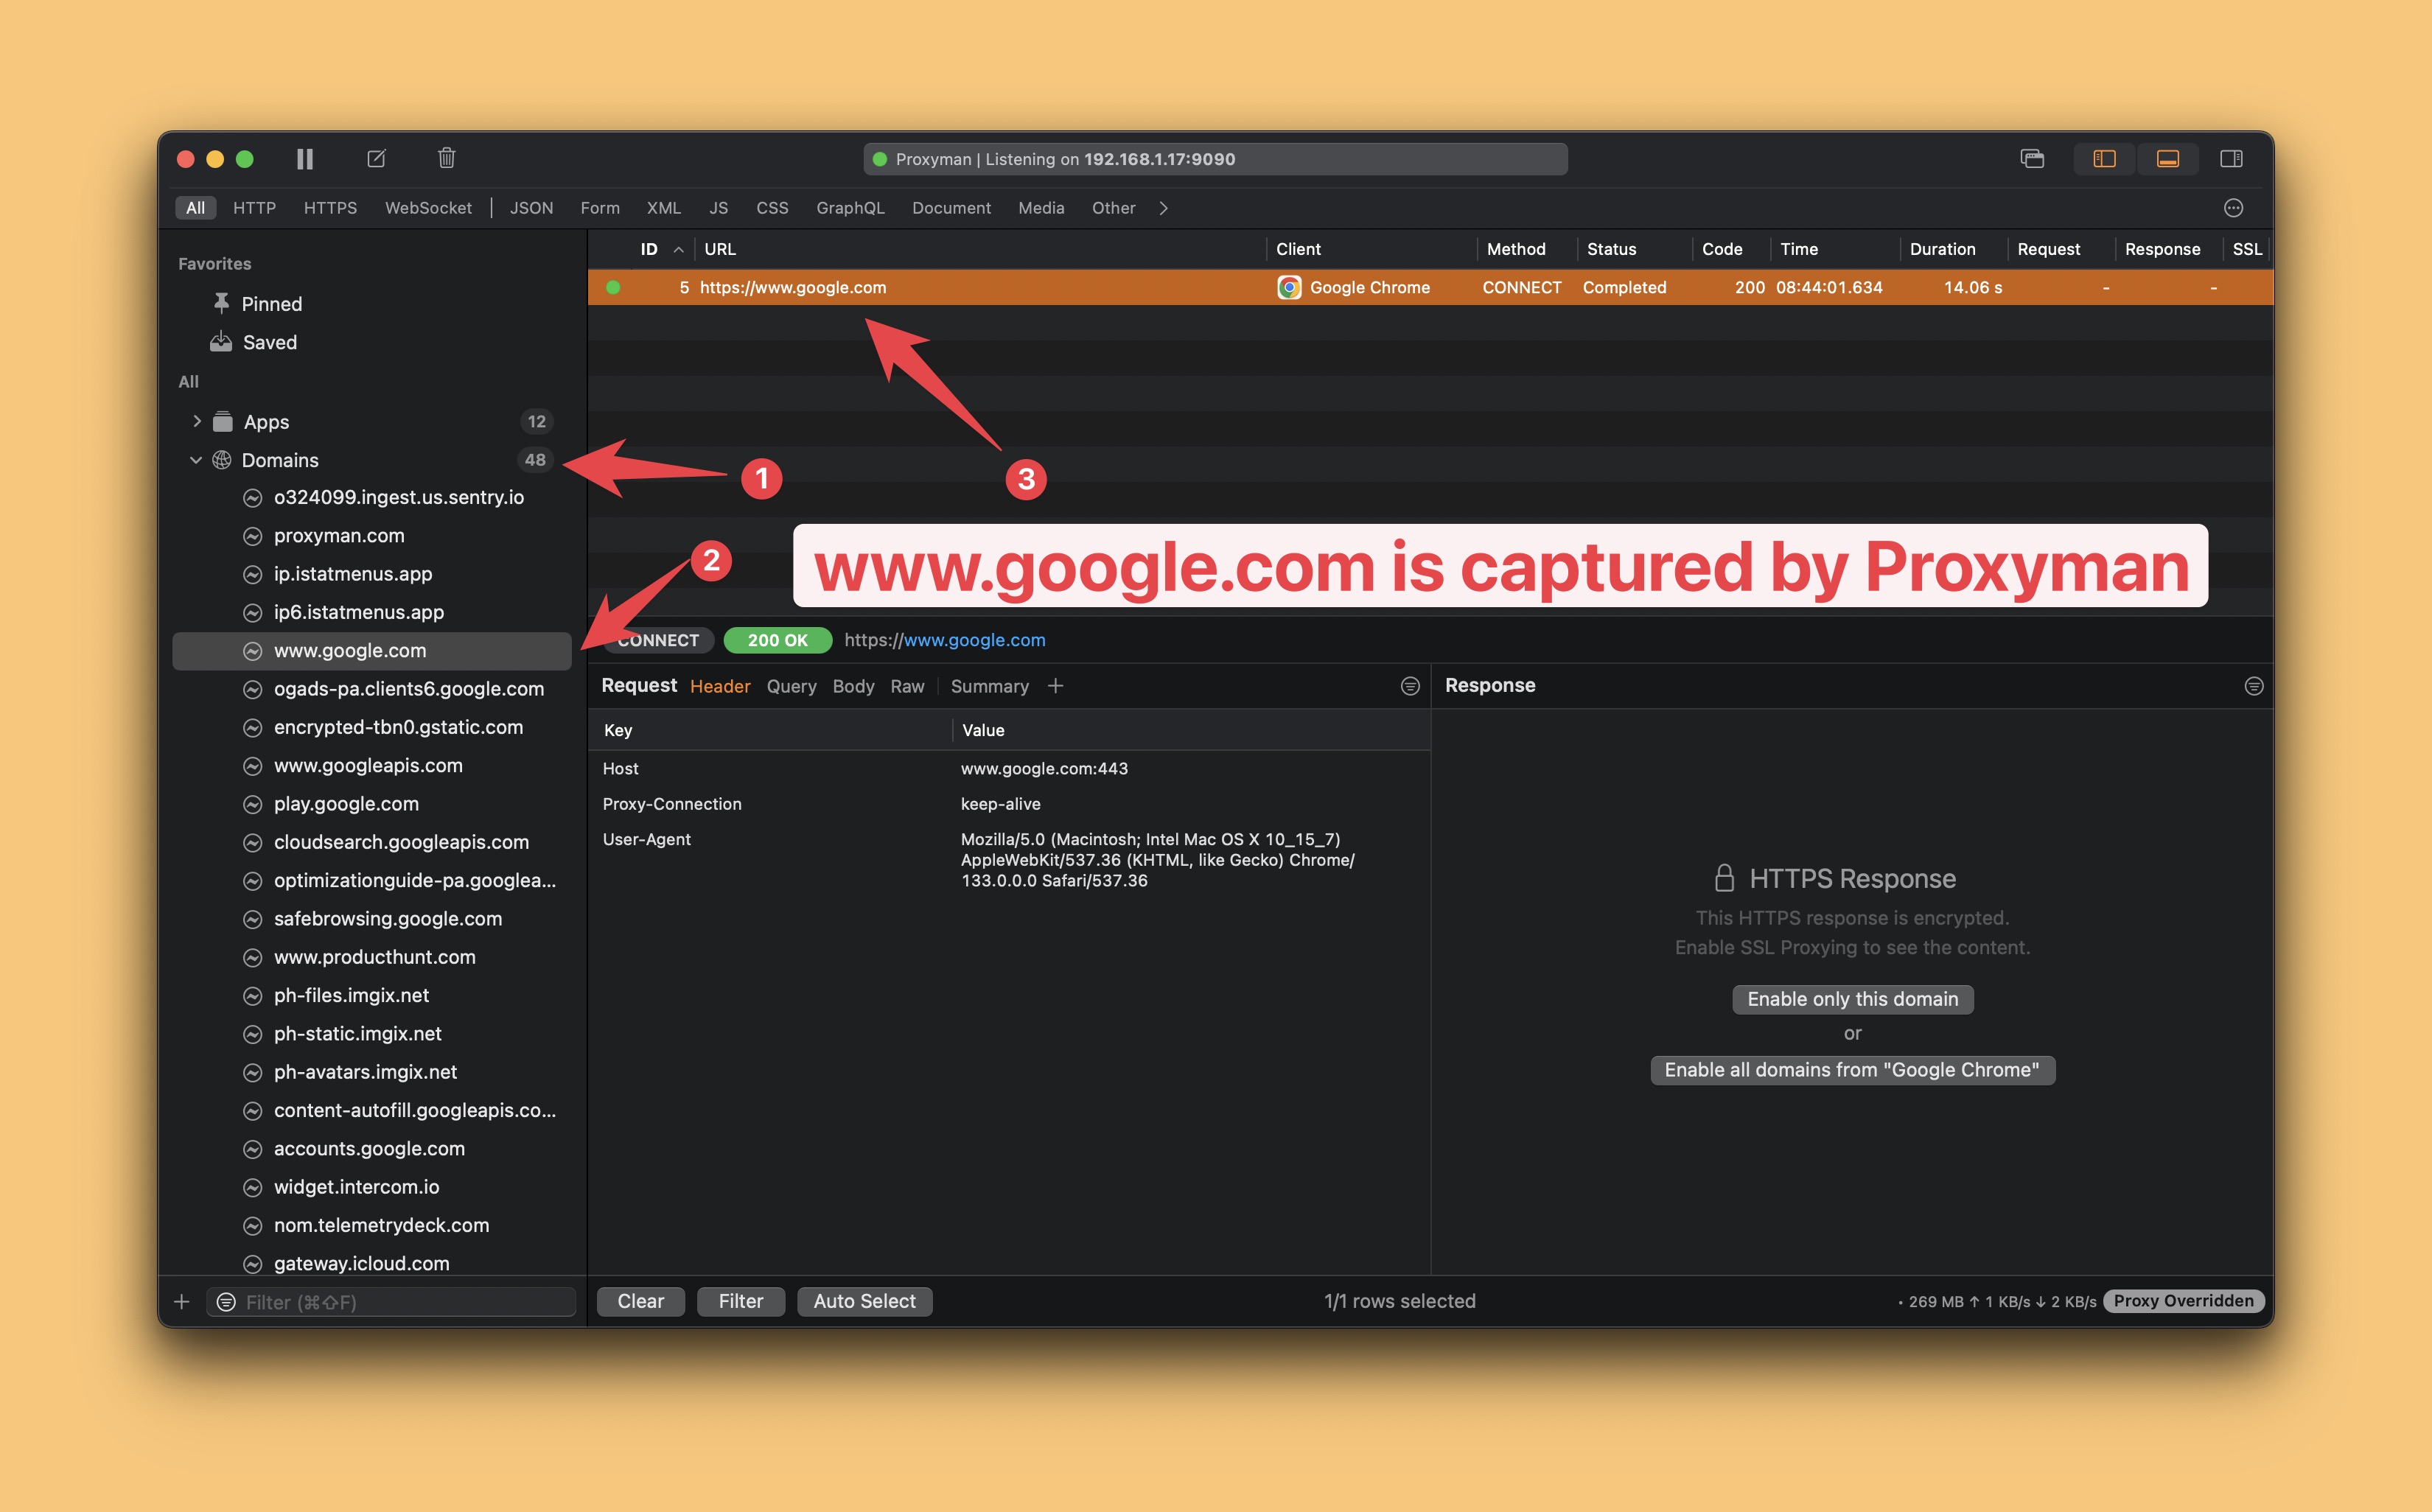
3. Try to make a first request to Proxyman
- Open Proxyman
- Open Google Chrome or Safari browser -> Visit https://www.google.com or https://www.producthunt.com or any other websites you want.
- At this point, you can see the request is captured by Proxyman.
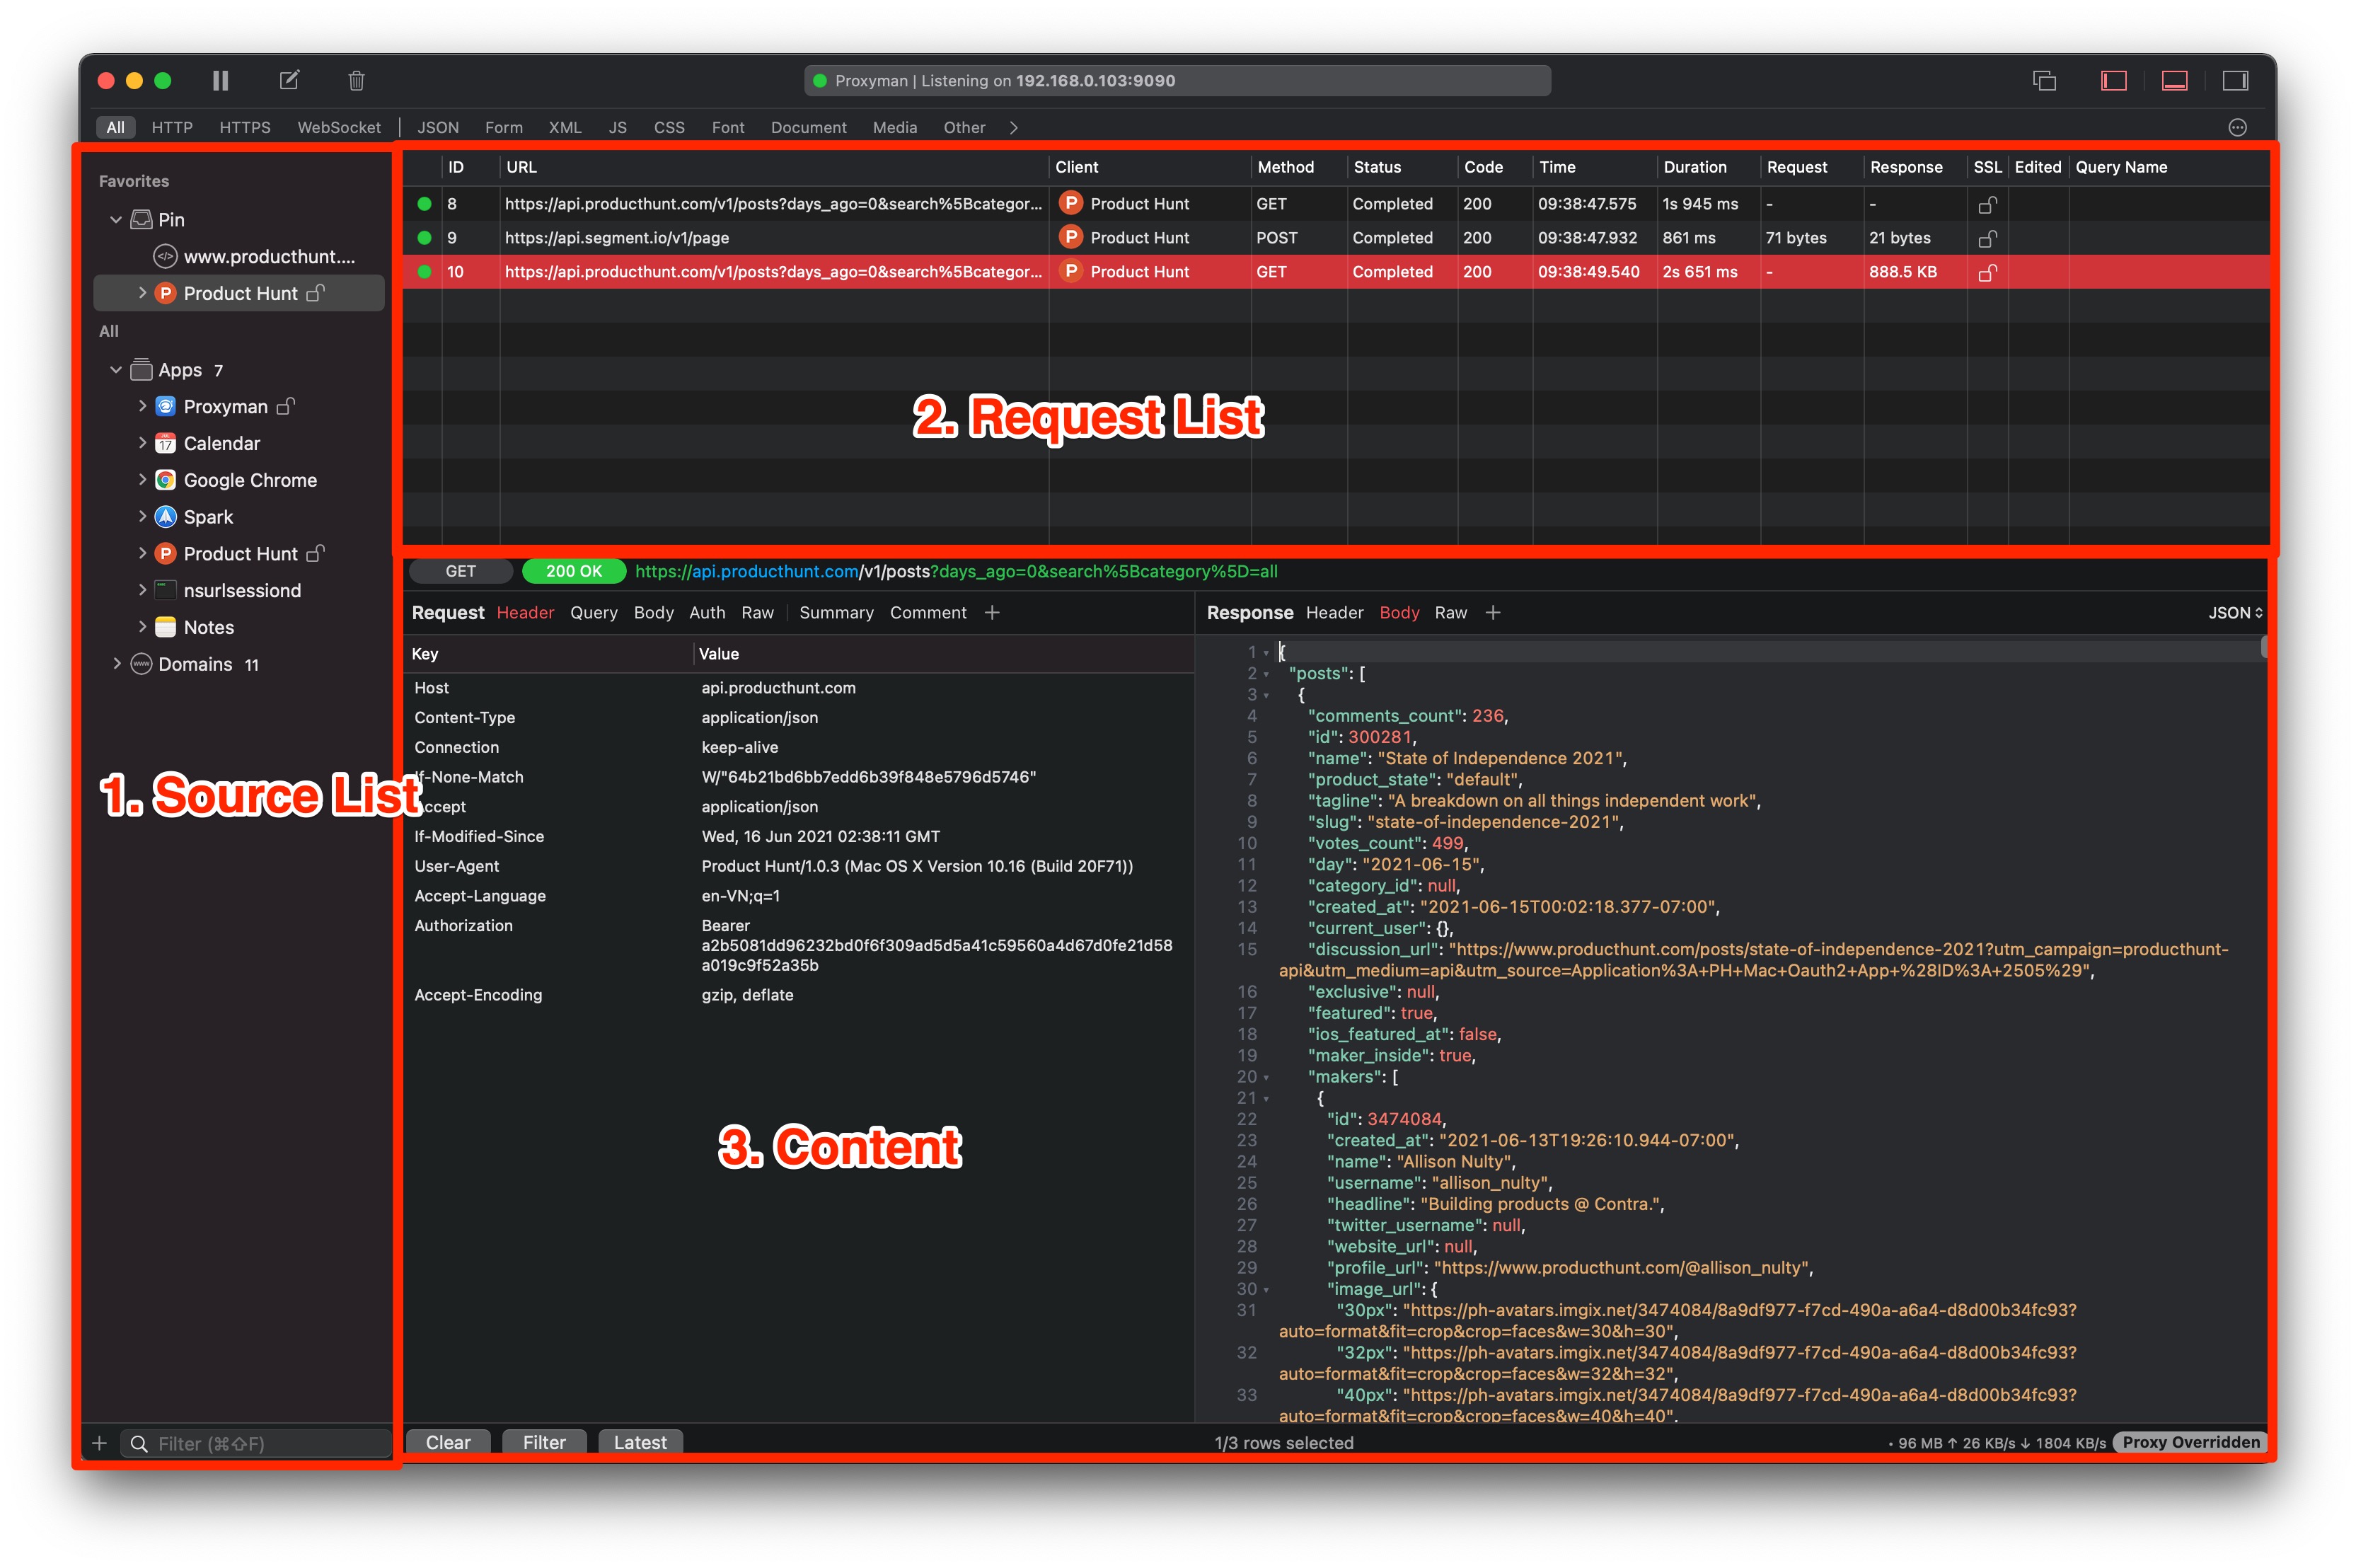
There are three essential parts.
- Source List (Left Panel) is where all apps and domains are listed.
- Request List (Middle Panel): All requests/responses from the selected Source.
- Content (Bottom Panel) is where you can see all Request/Response content.
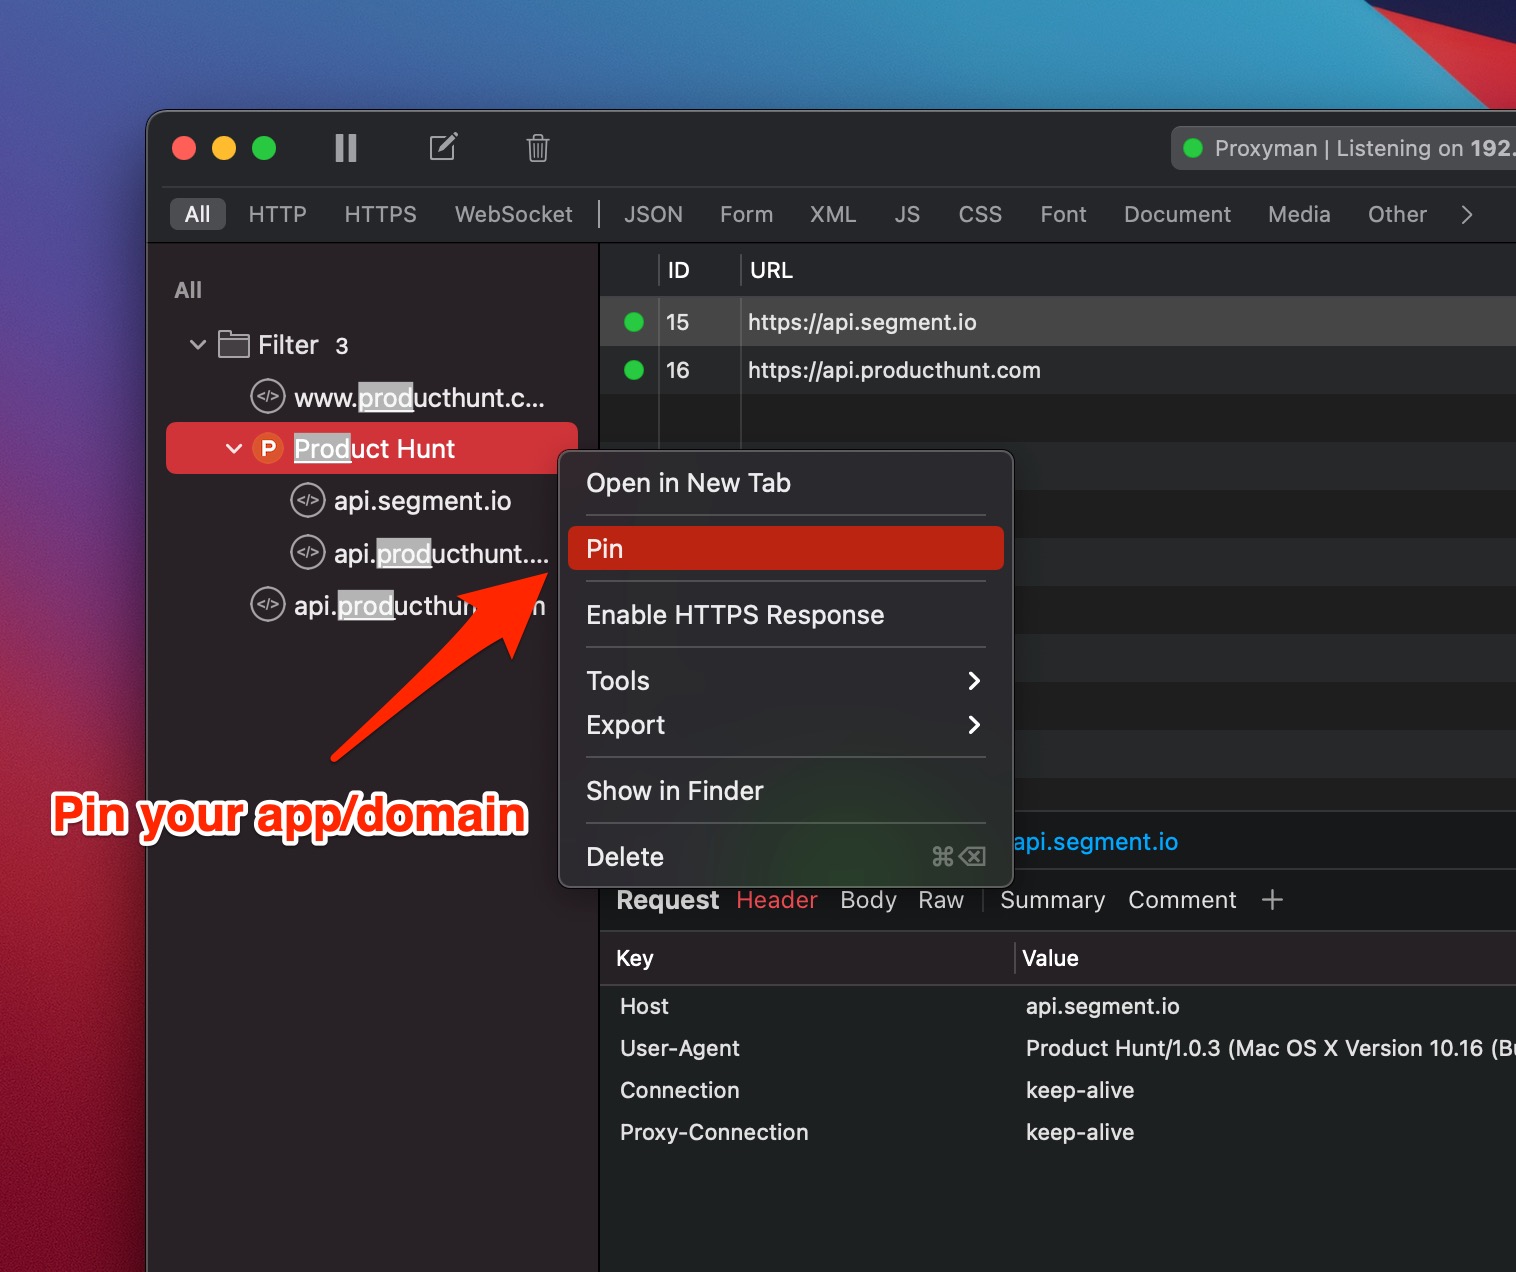
3. Search and Pin your app/domain
You could quickly search your apps/domains by using "Ctrl+Shift+F" and then selecting the "Pin" in the right menu.
4. Decrypt HTTP/HTTPS Request and Response
To see HTTP/HTTPS Traffic in plain text from the ProductHunt app, please follow the following step:
- Select your desired domains or app on the Left Panel.
- Select Enable SSL Proxying for this domain or the entire app on Bottom Panel.
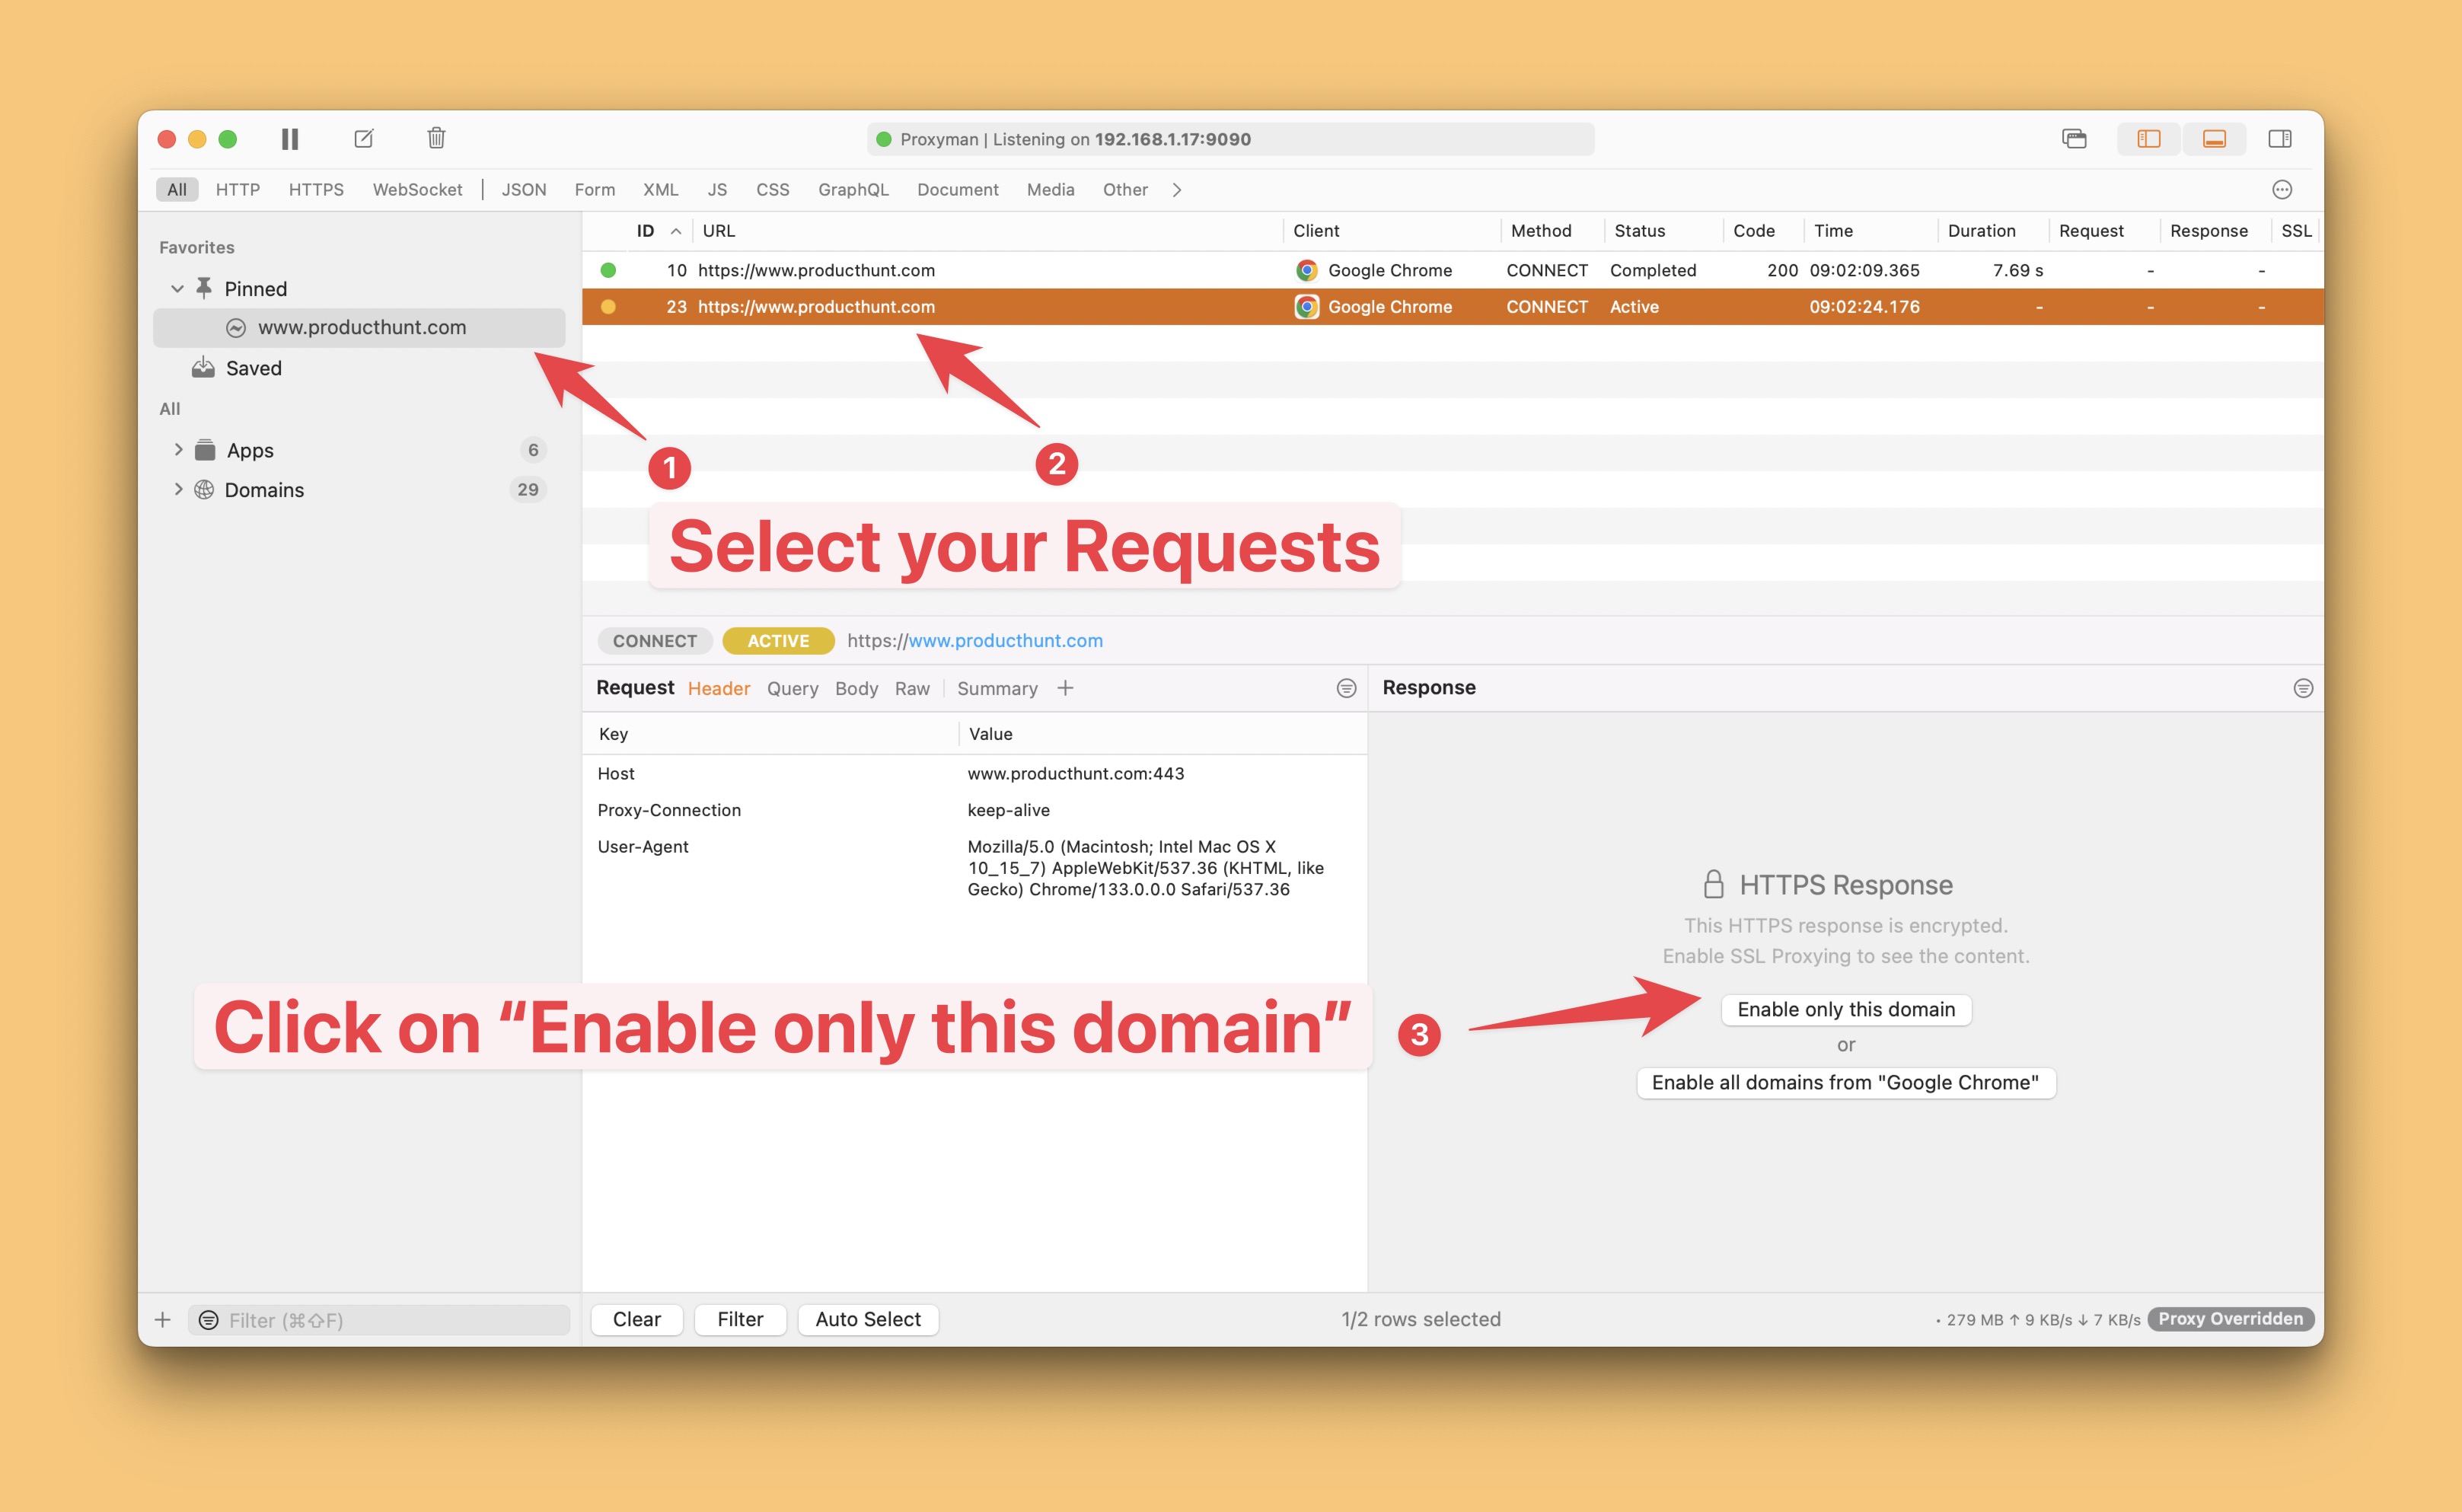
By enabling SSL for particular apps or domains, Proxyman only intercepts these particular domains and proxies other traffic. As a result, Proxyman doesn't burden your Macbook CPU and has less energy for your Macbook battery.
5. Proxyman CA Certificate
We understand that this process is so complicated with other tools, so we carefully re-design it to simplify it.
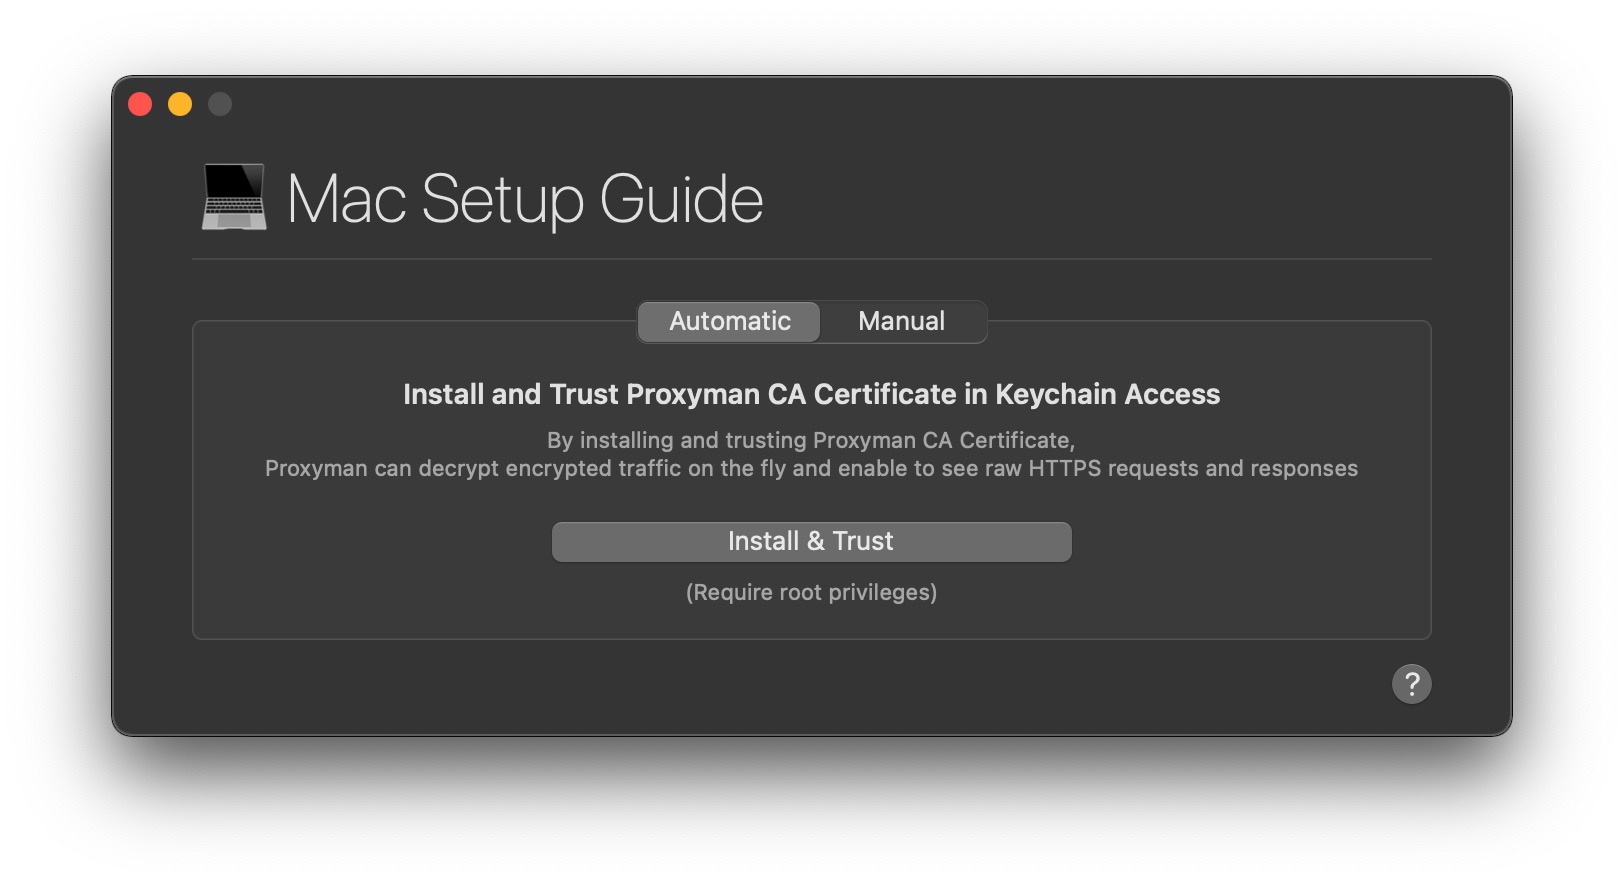
As soon as you enable SSL Proxying, Proxyman would prompt a Certificate Installation Windows:
You can either install the certificate in an Automatic or Manual way.
- Automatic: It's a useful solution for installing and trusting the Proxyman Certificate in one step.
- Manual: You can install and trust manually. It's suitable for power-user.
If you're a beginner, we highly recommend using the Automatic way because it can be done with a single click.
6. Request and Response Previewer
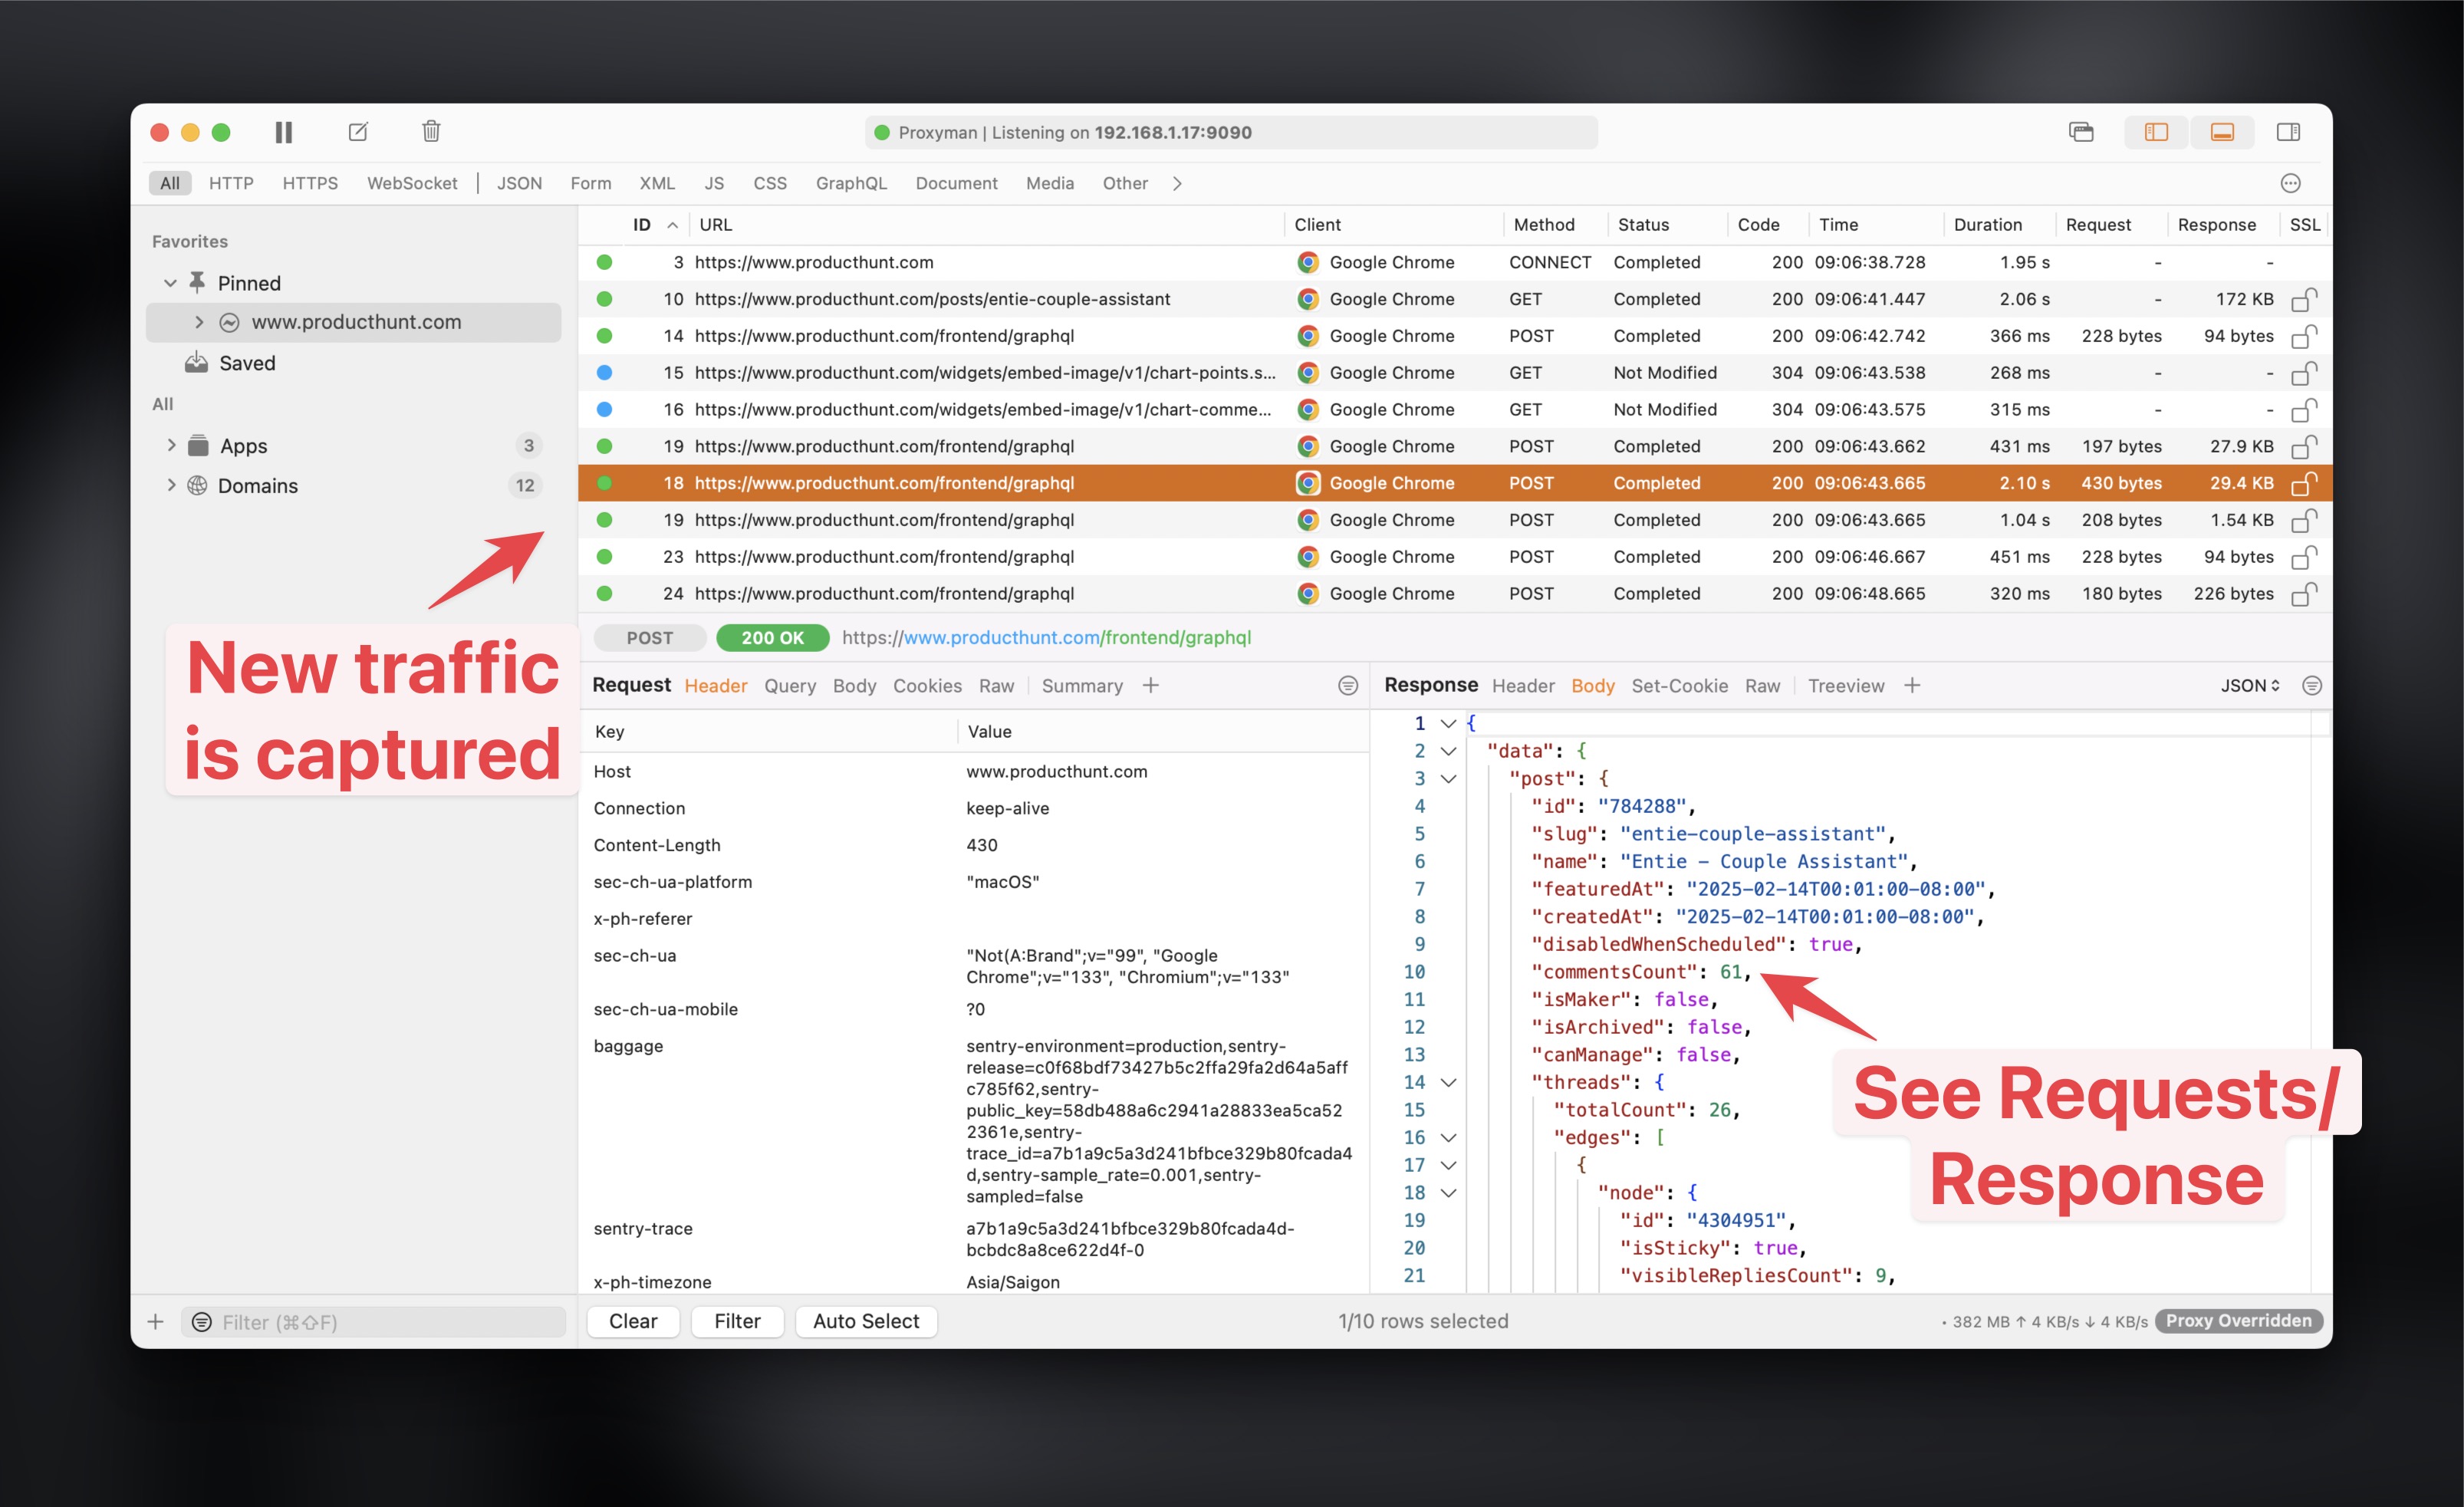
After installing the Proxyman Certificate, it's a perfect time to debug 😋. Proxyman is now capable of intercepting the HTTPS request & response and automatically displaying in pretty-JSON viewers.
-
Try to reload your website -> You can see the response is captured by Proxyman. From the Content panel (Bottom-Panel), you can navigate to:
-
Header, Query, Cookies, and JSON response
All content viewers are built-in with a native search bar. So you can manipulate or search the content by pressing Ctrl-F as usual.
7. Debugging Tools
This section is going to show you how to use some debugging tools to help you debug your API.
7.1 Repeat with new parameters
- Right click on the Request -> On the context menu, select "Edit & Repeat"
- You can modify your URL, Method, Headers, Body, and try a new request with the new parameters.
- It's useful to test your API with different parameters.

7.2 Export your Proxyman Session
- Right click on the request or a domain in the left panel -> On the context menu, select Export -> Proxyman Log
- Useful to share the request with your teammates or QA team ❤️ Or directly attach the log session to any Project Management like Jira or Trello.
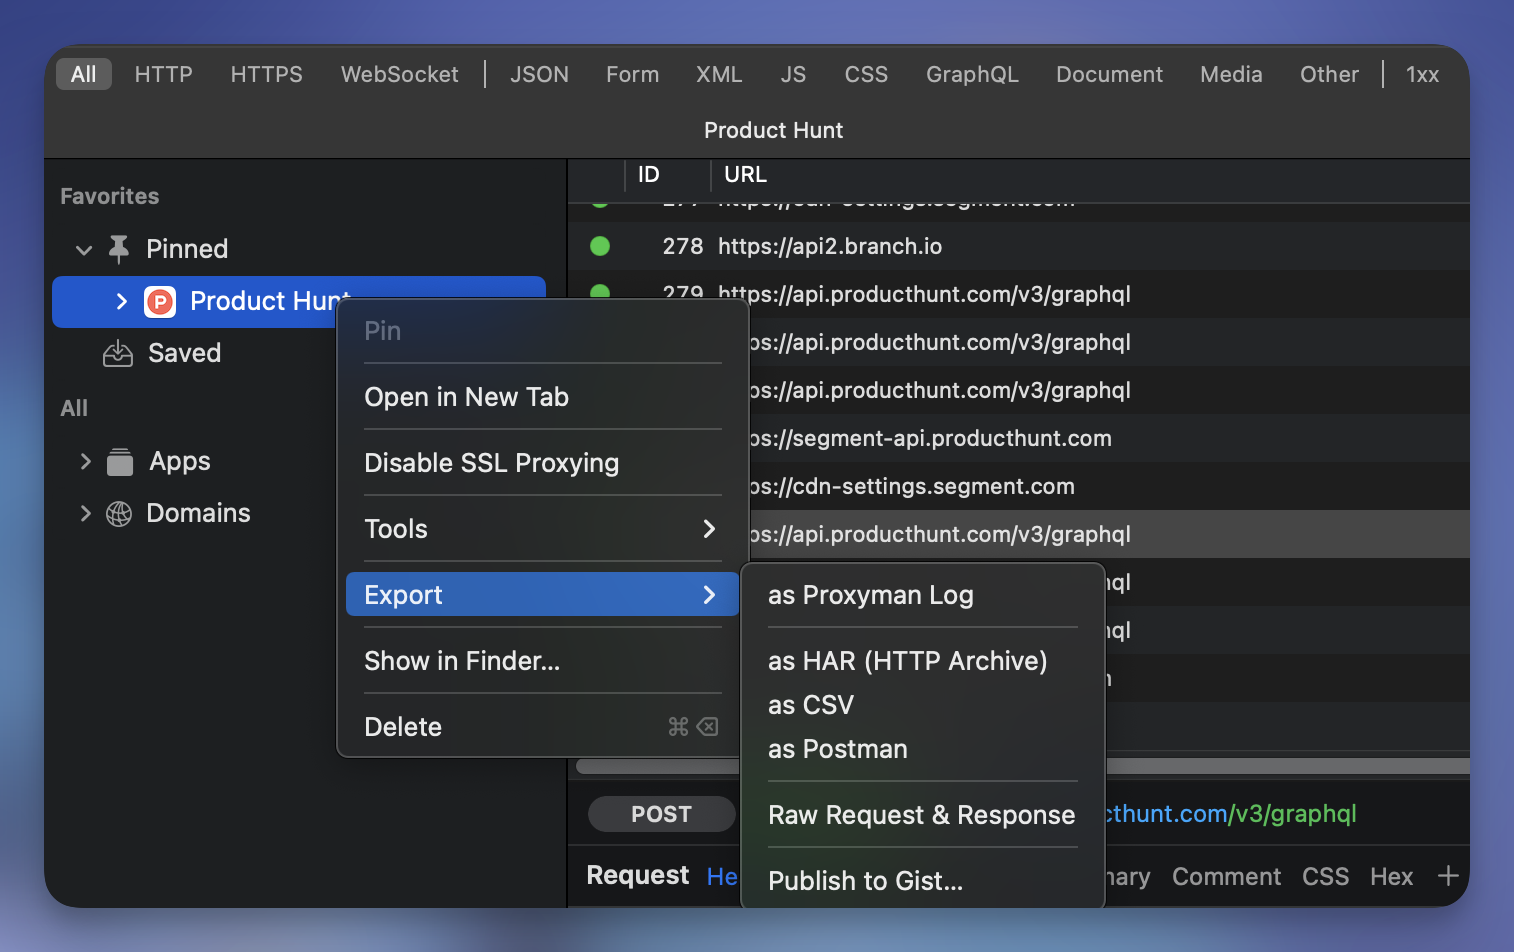
You can also export the current Proxyman Session as a HAR file.
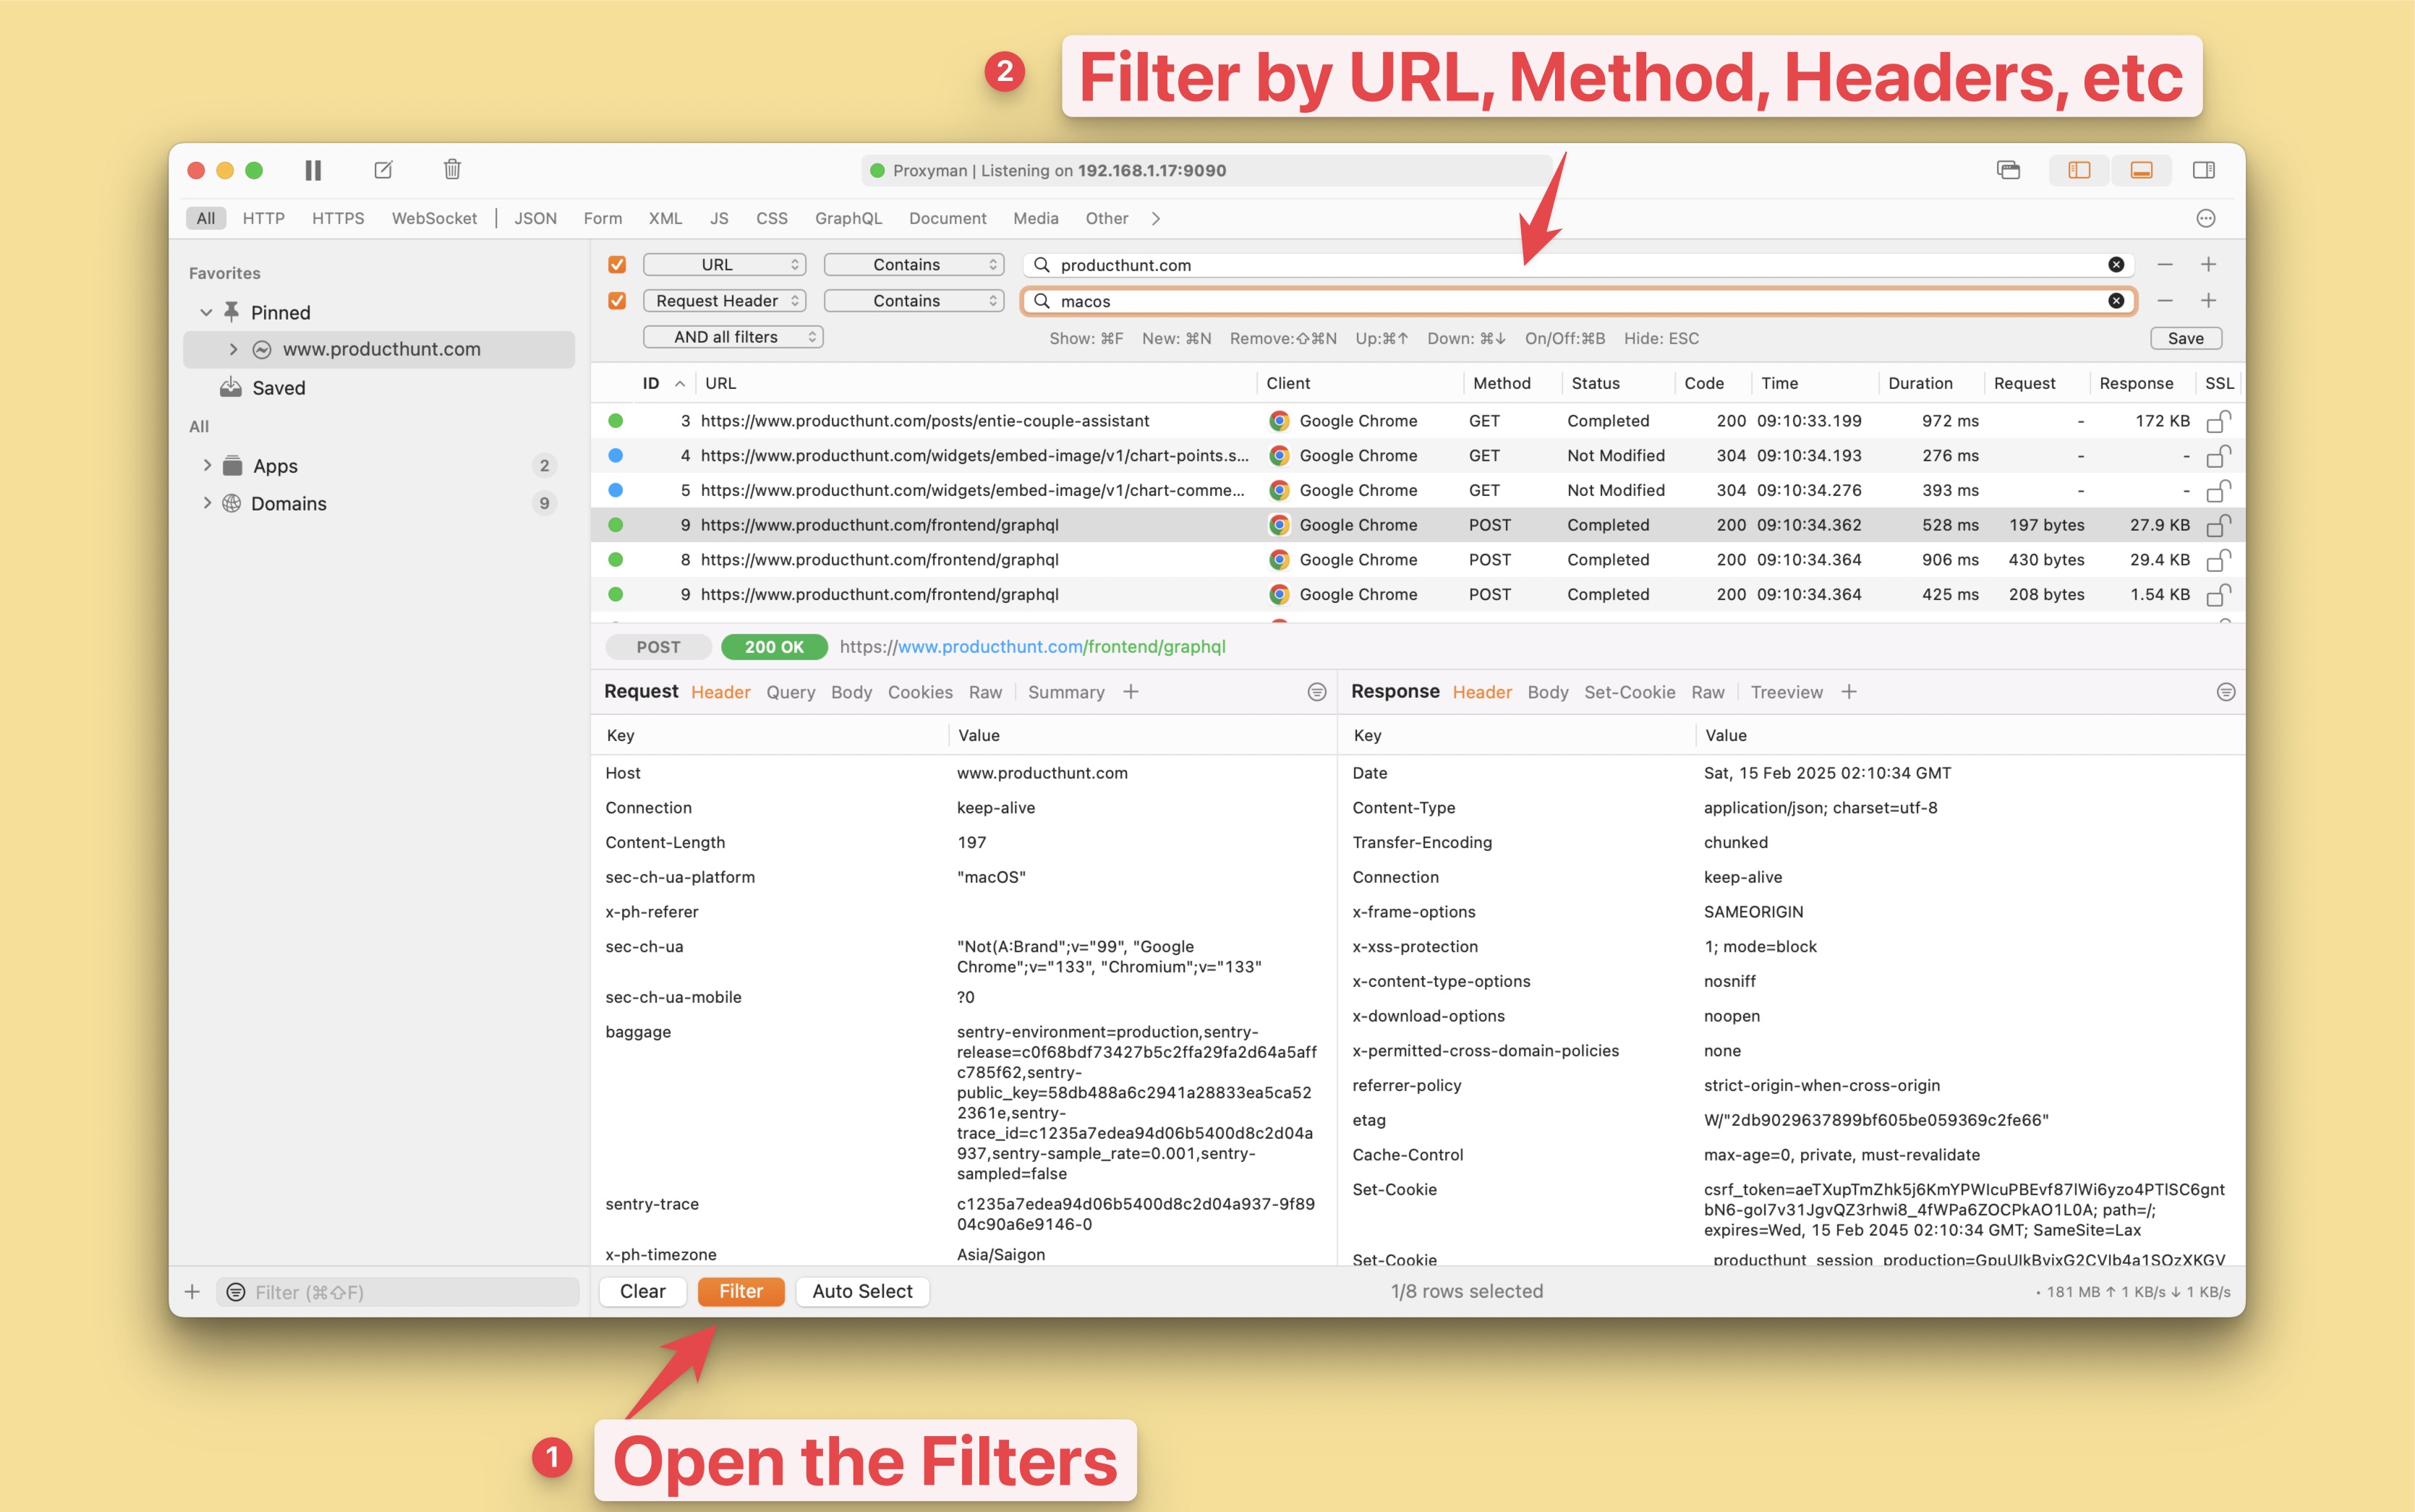
7.3. Multiple Filters
- You can filter the request by URL, Method, Status Code, etc.
- Able to create multiple filters and apply to the request list.
- It's useful to find the request you want.
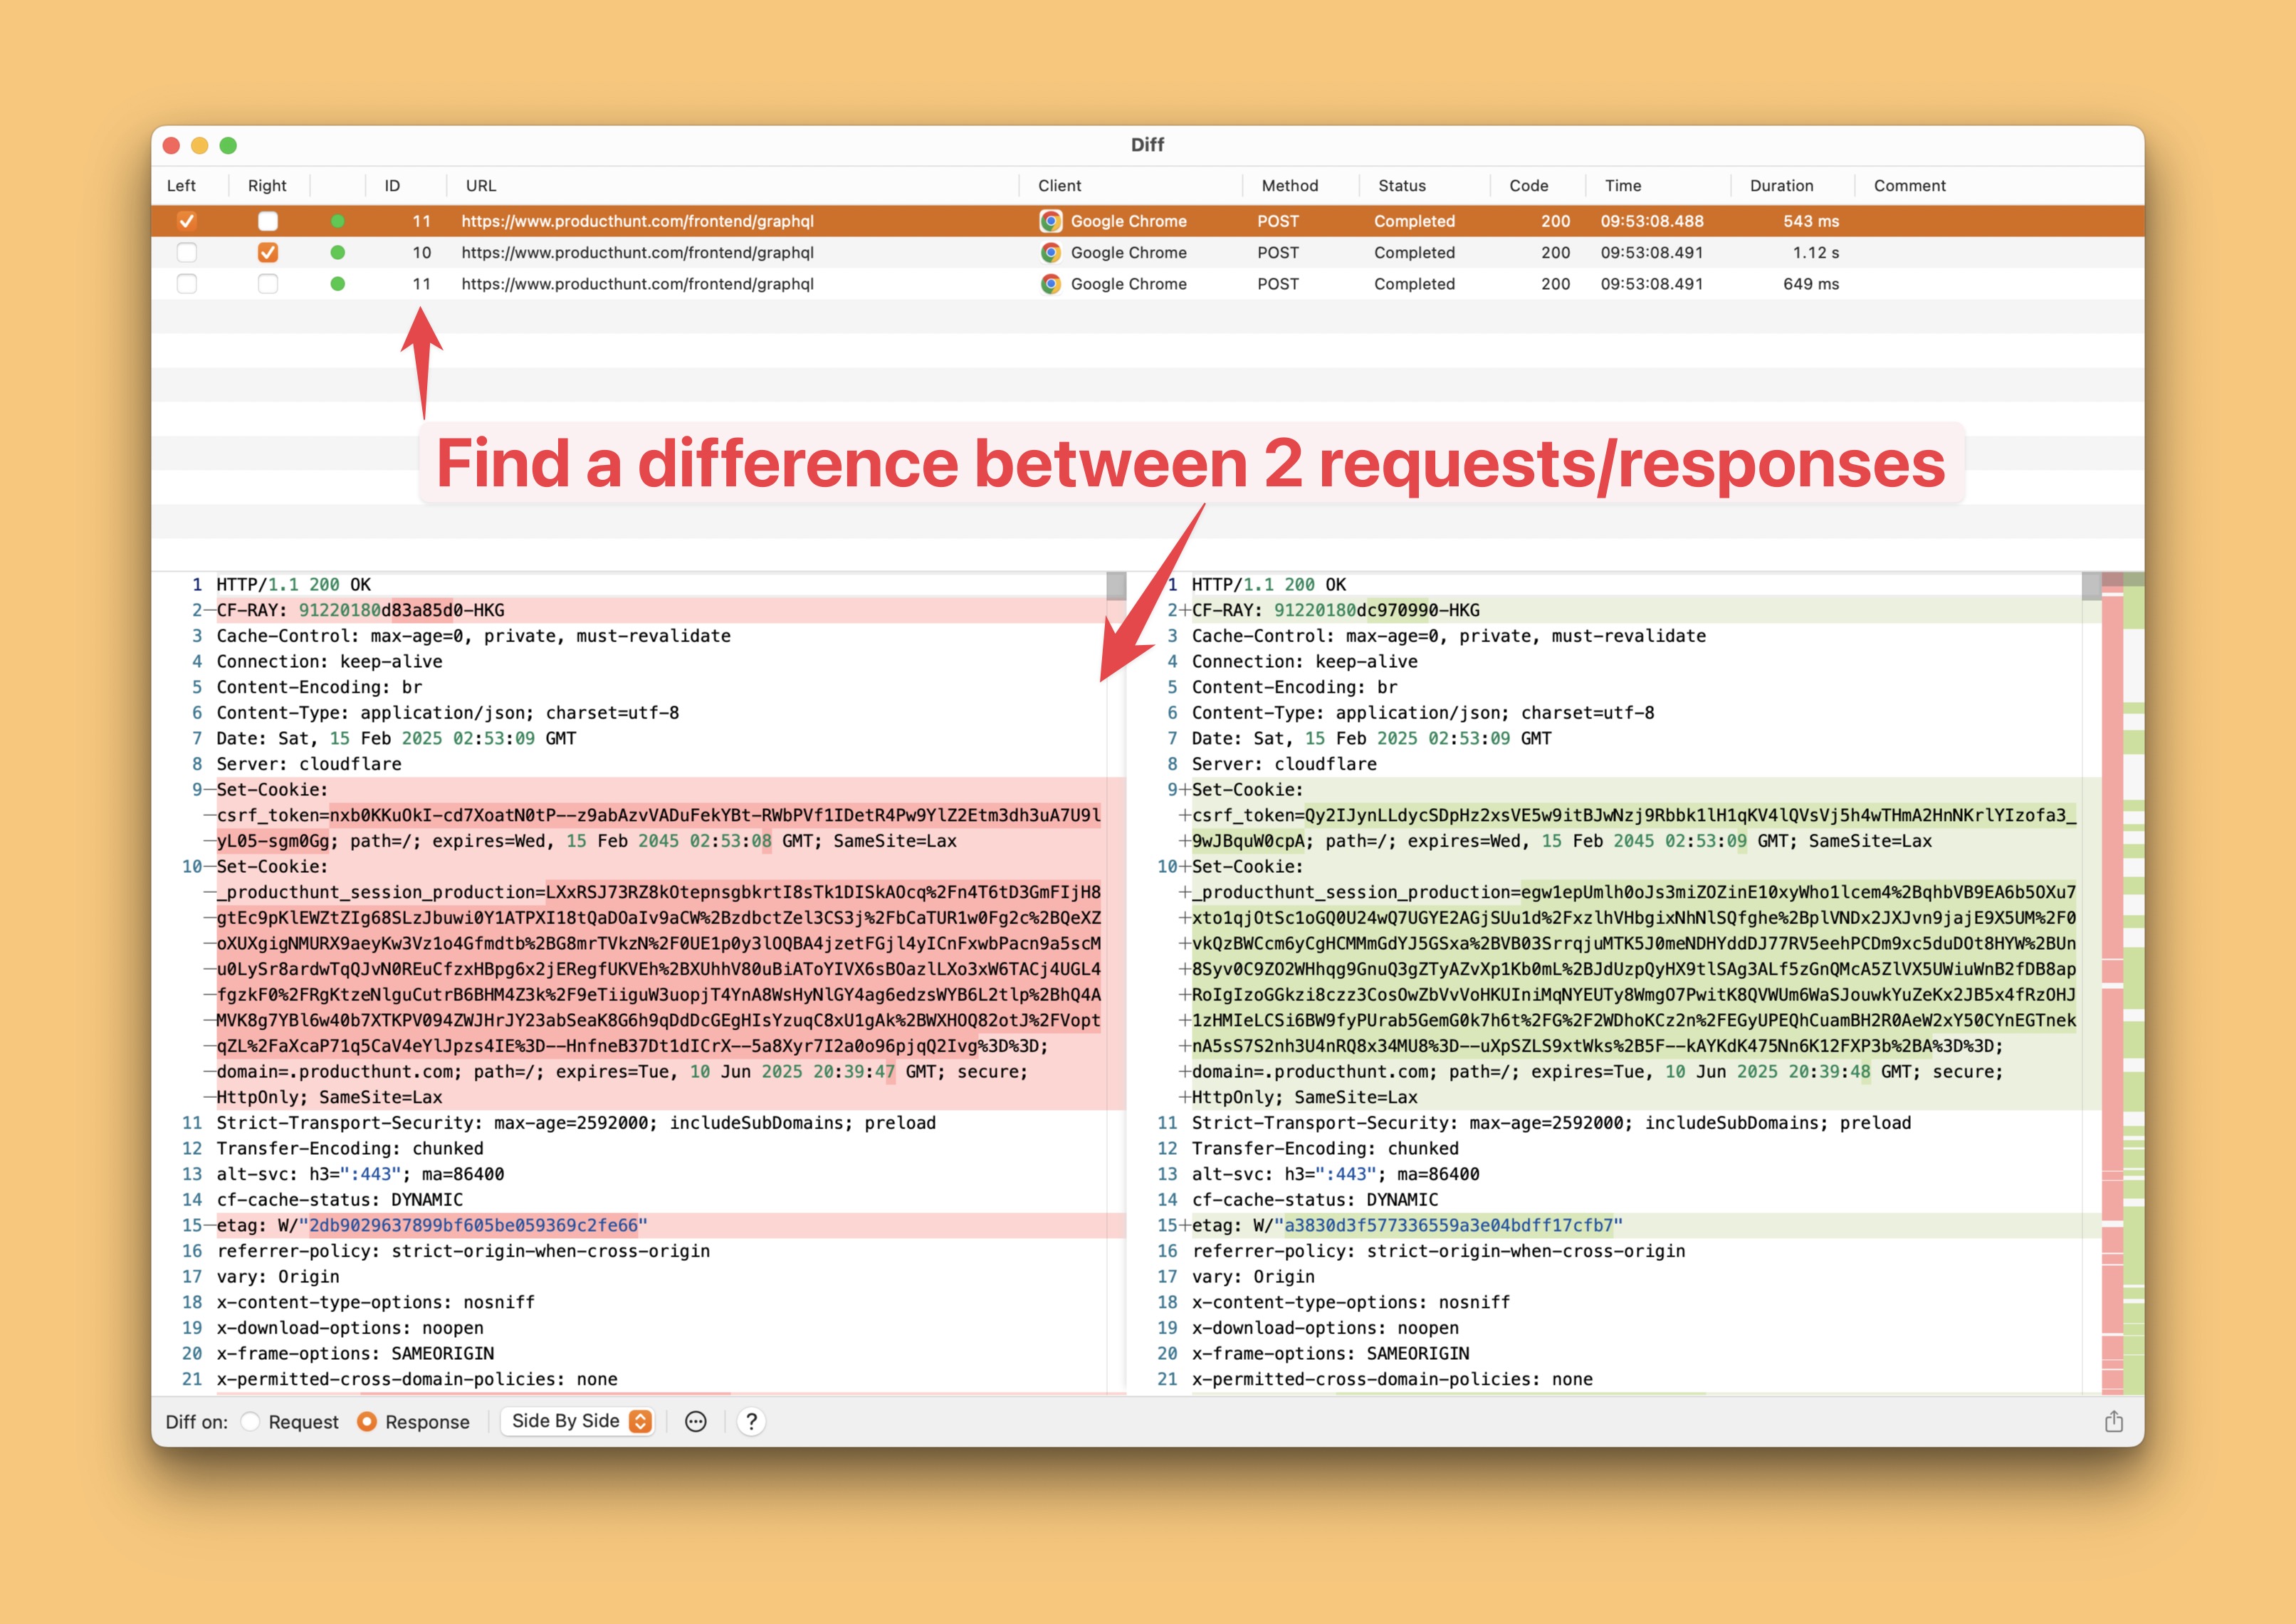
7.4 Find a different between two requests/responses with a Diff Tool
- Select 2 or many requests -> Right click -> On the context menu, select Tools -> Add to Diff Pool -> New Diff windows will open
- It's useful to find the difference between two requests/responses.
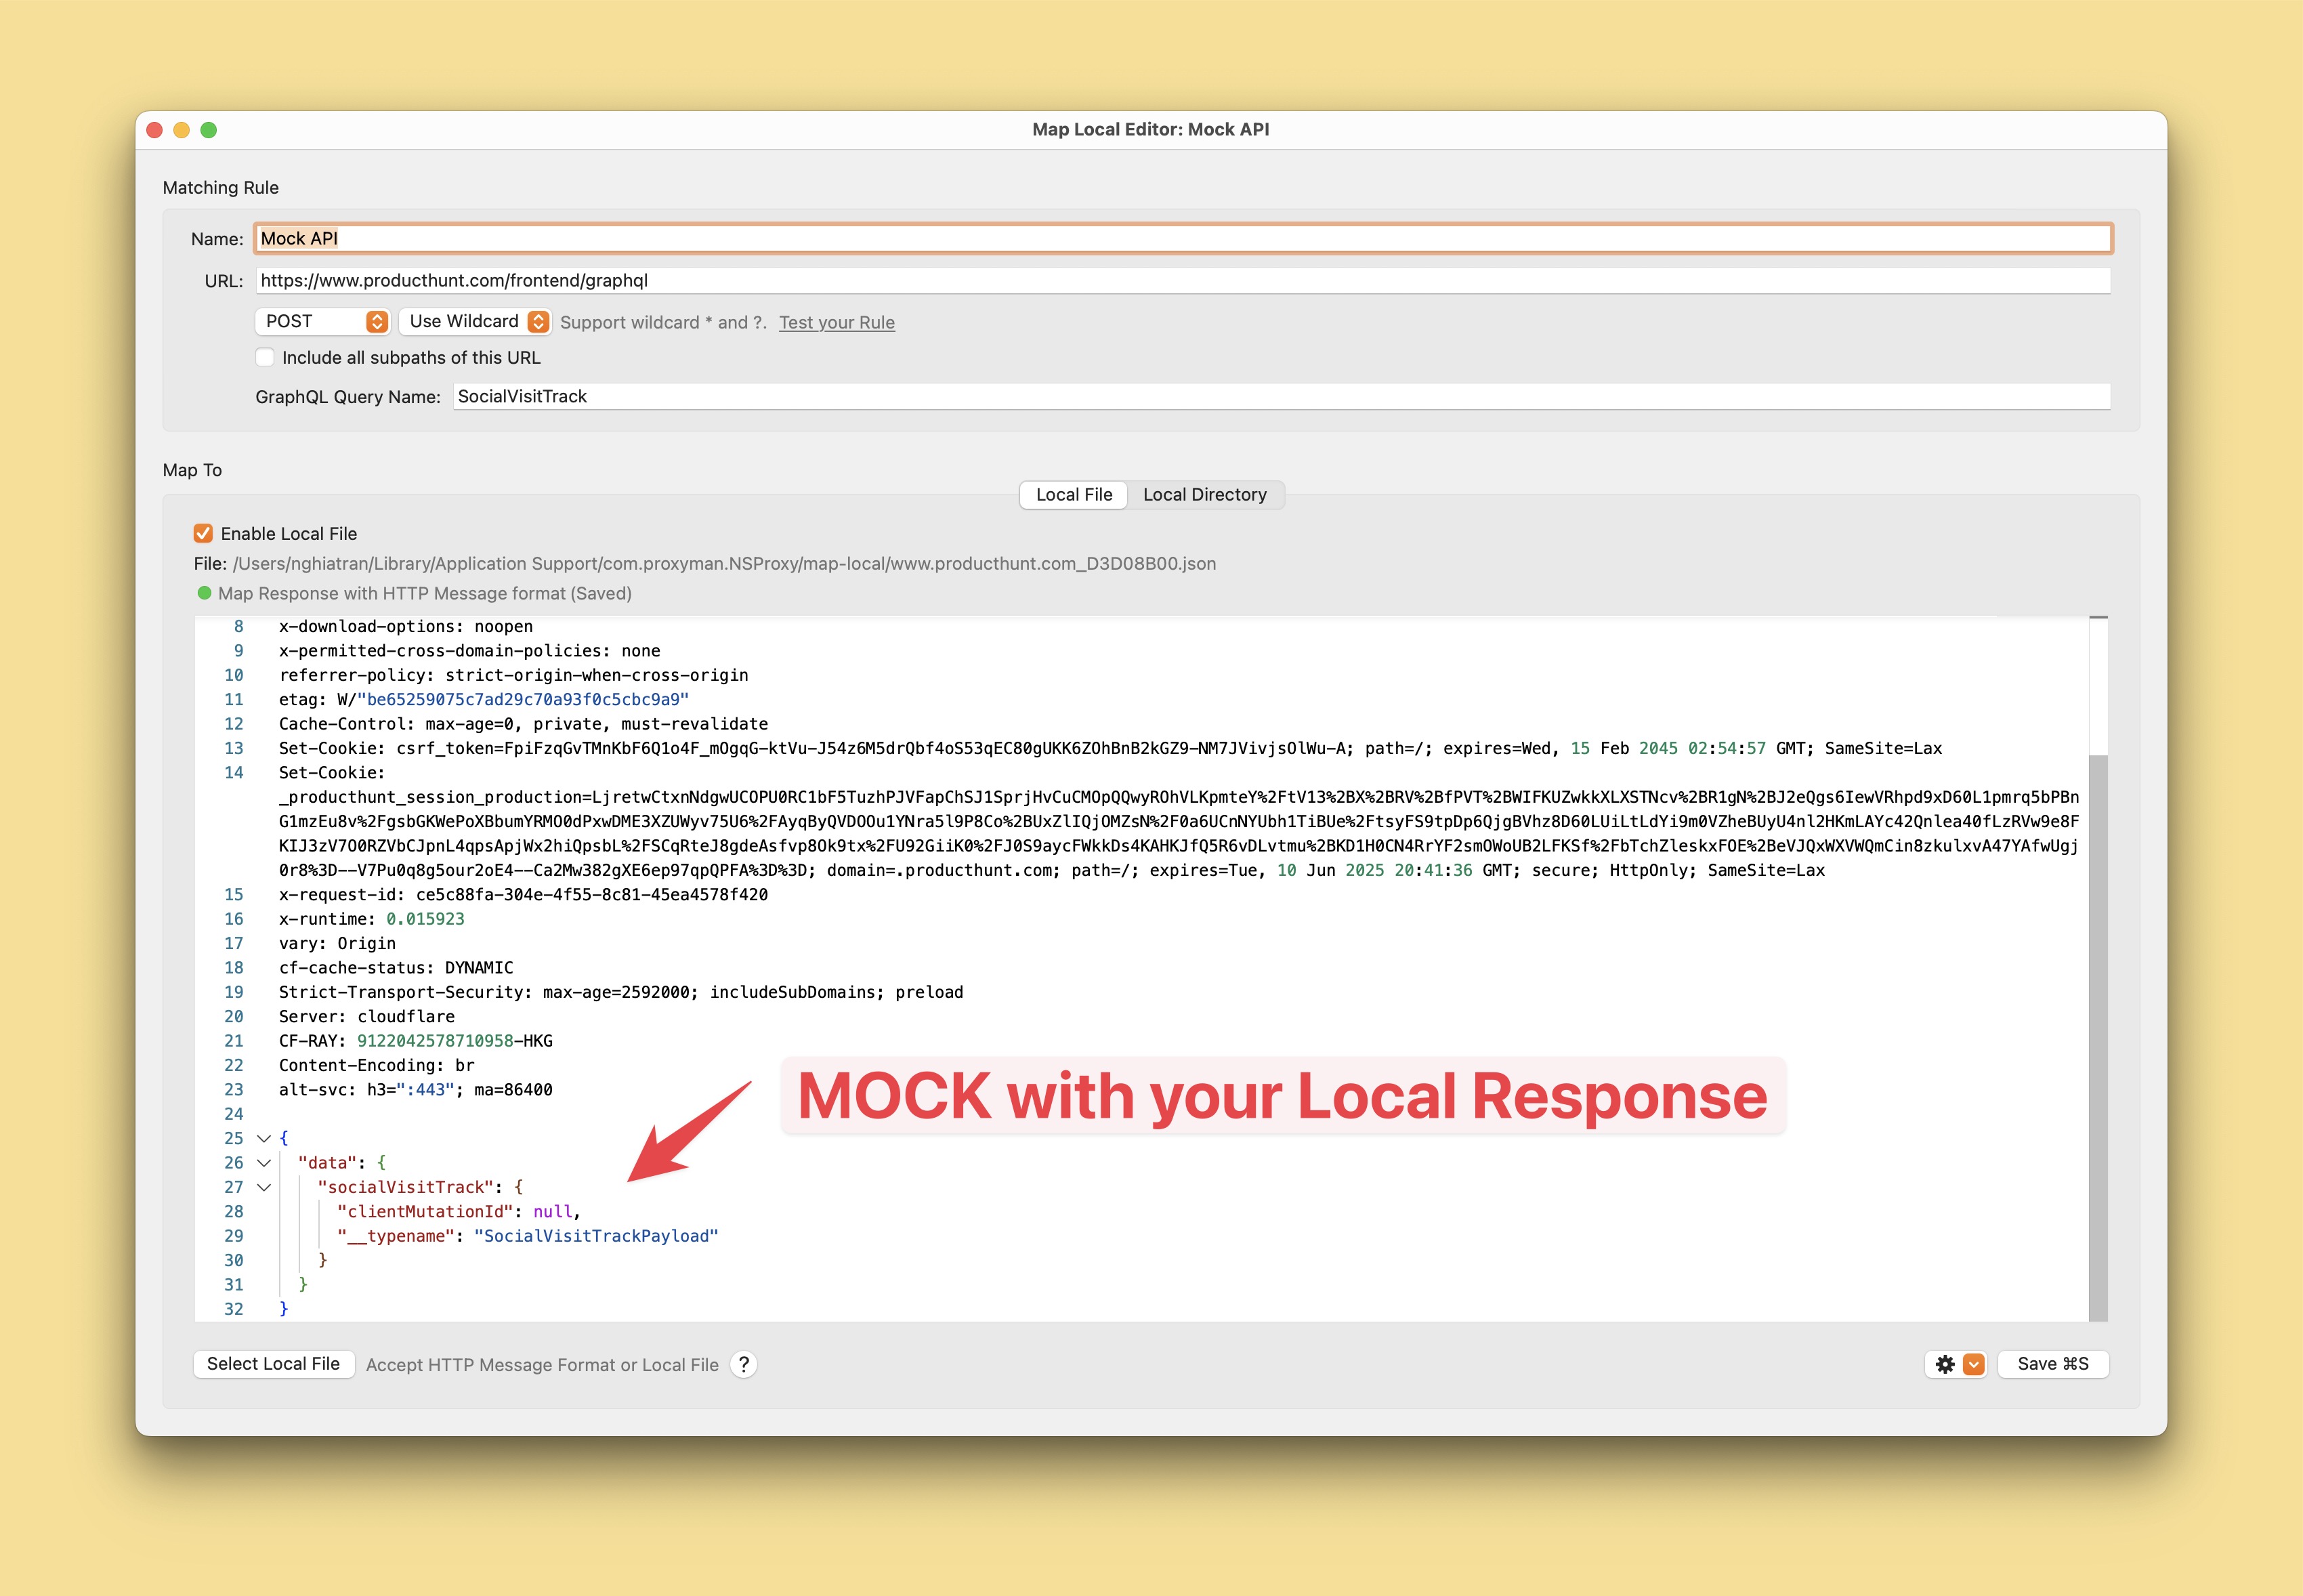
7.5 Mock API Response with Map Local
- Select a request -> Right click -> On the context menu, select Tools -> Map Local -> New Windows will open -> You can modify your Response Body, Status Code, Headers, etc.
- It's useful to mock the API response with a local file.
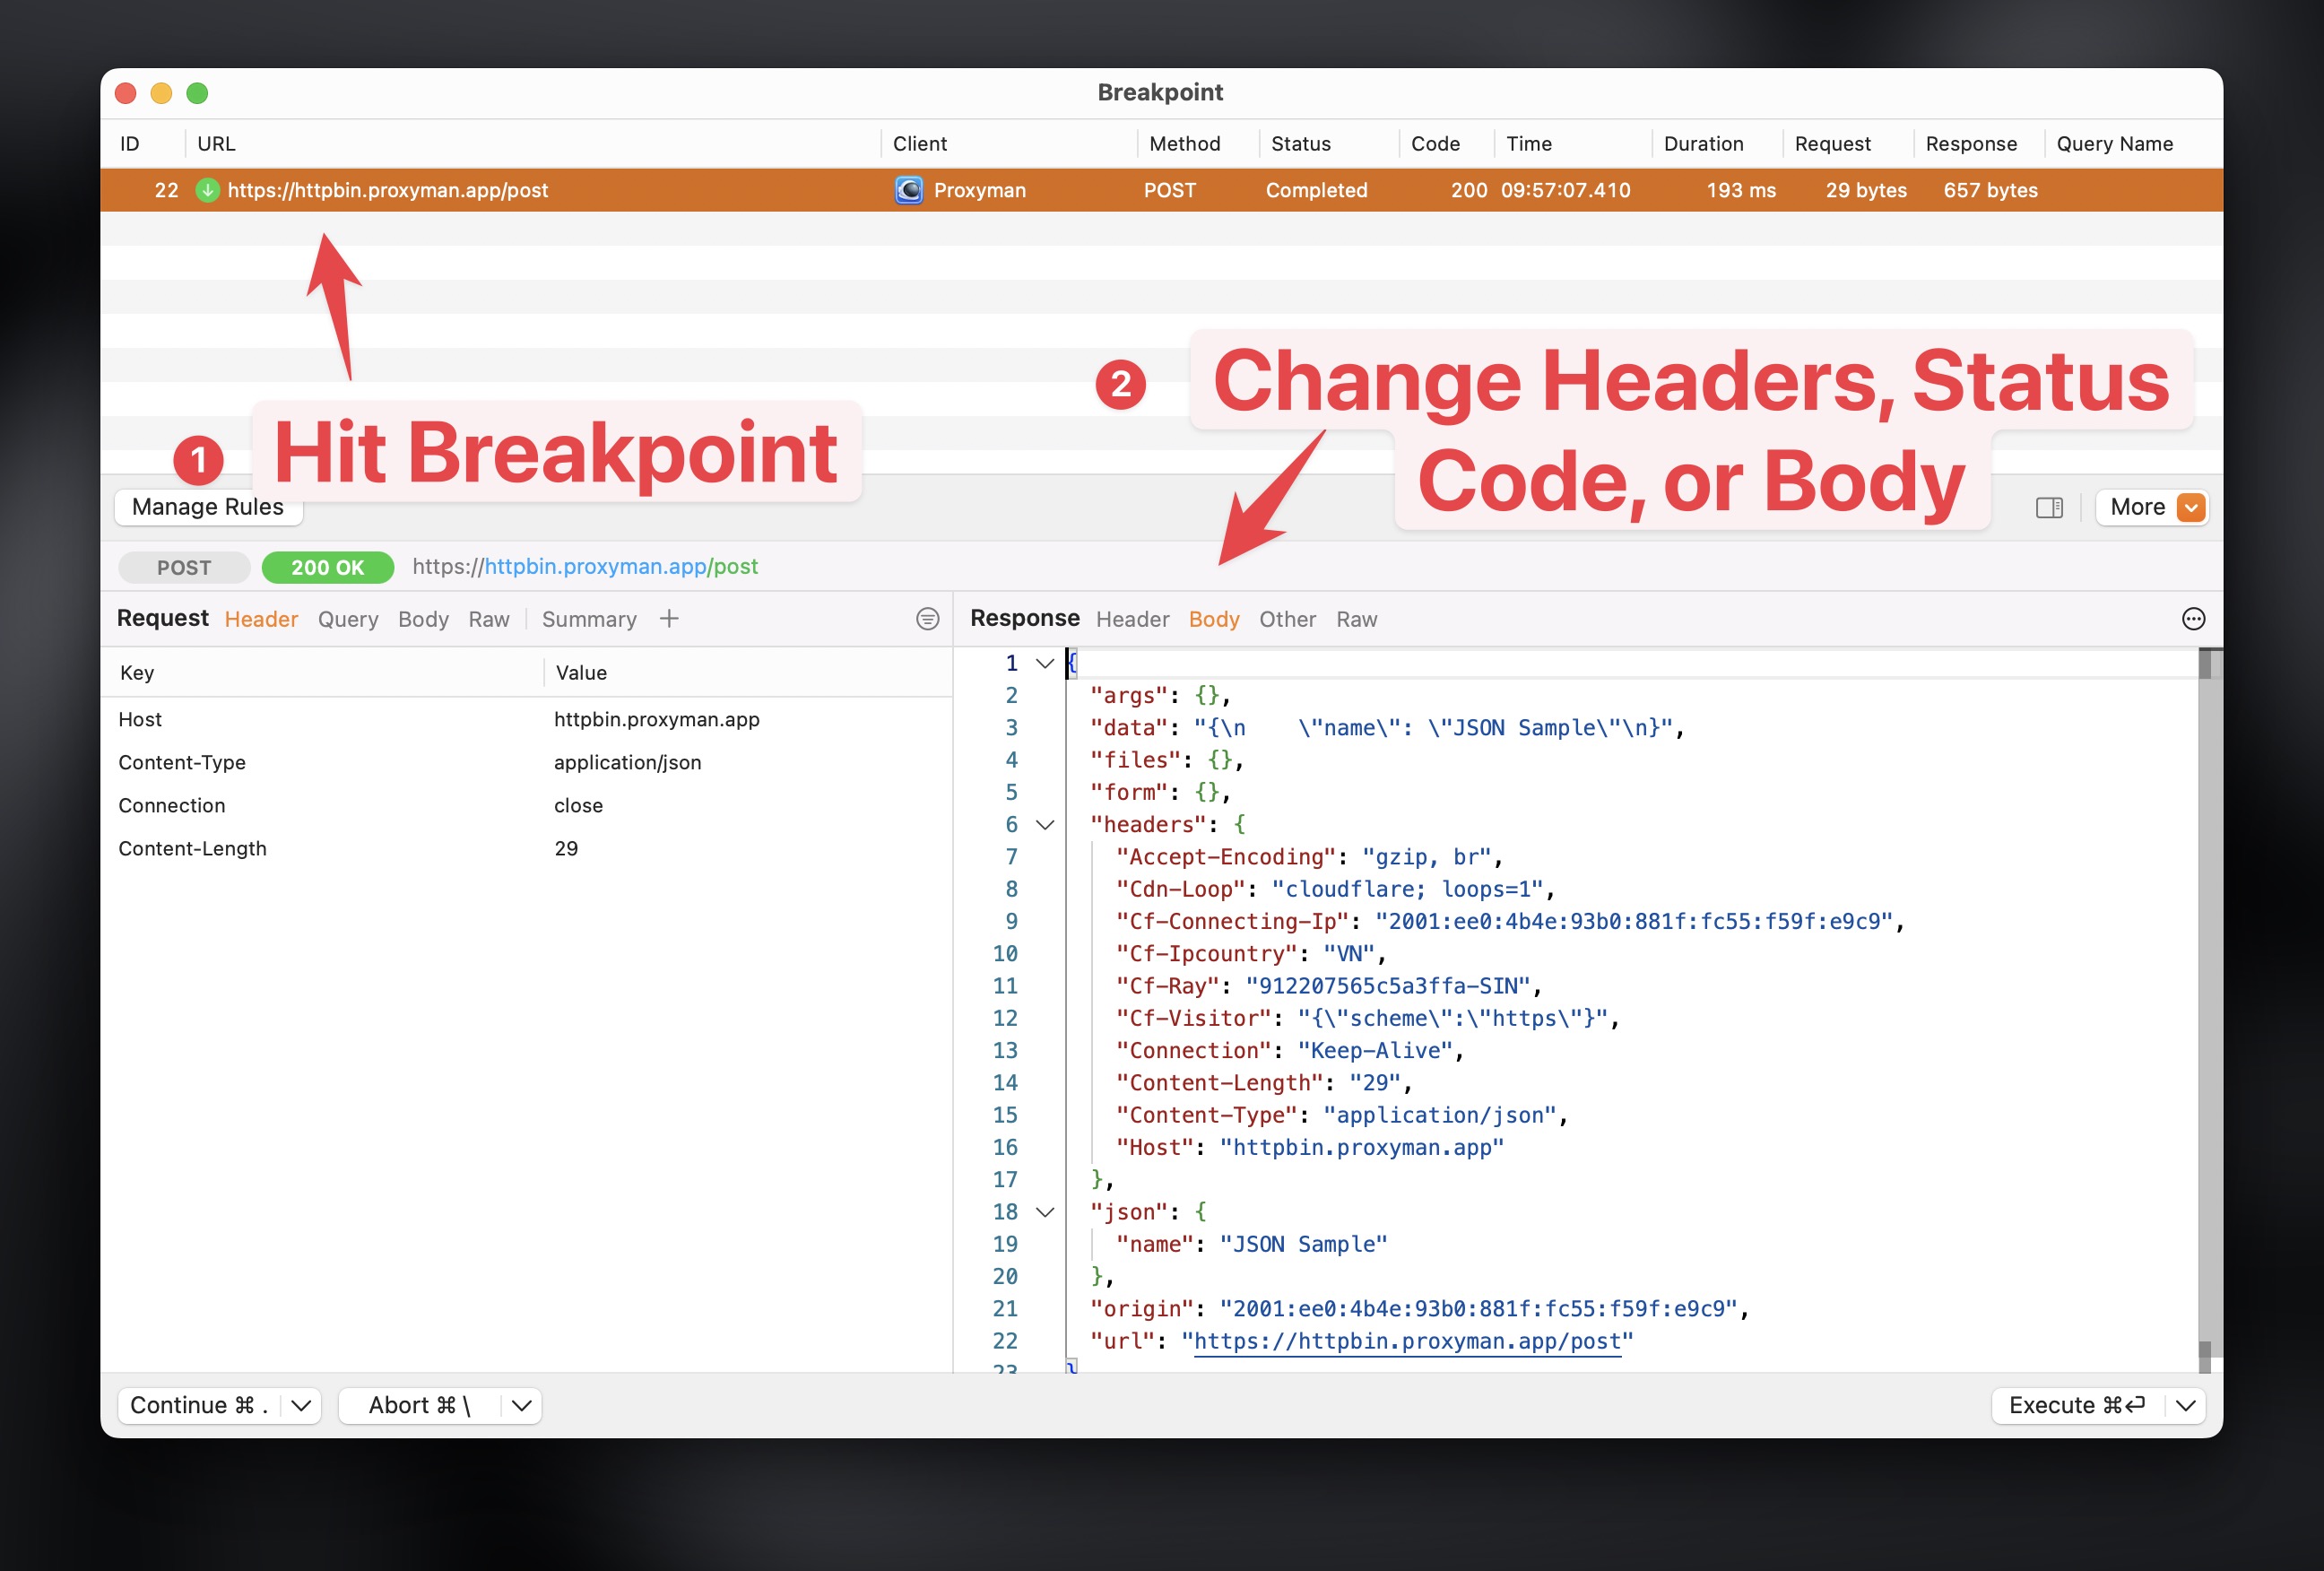
7.6 Modify the request and response on the fly with Breakpoint
- Select a request -> Right click -> On the context menu, select Tools -> Breakpoint -> Create a breakpoint
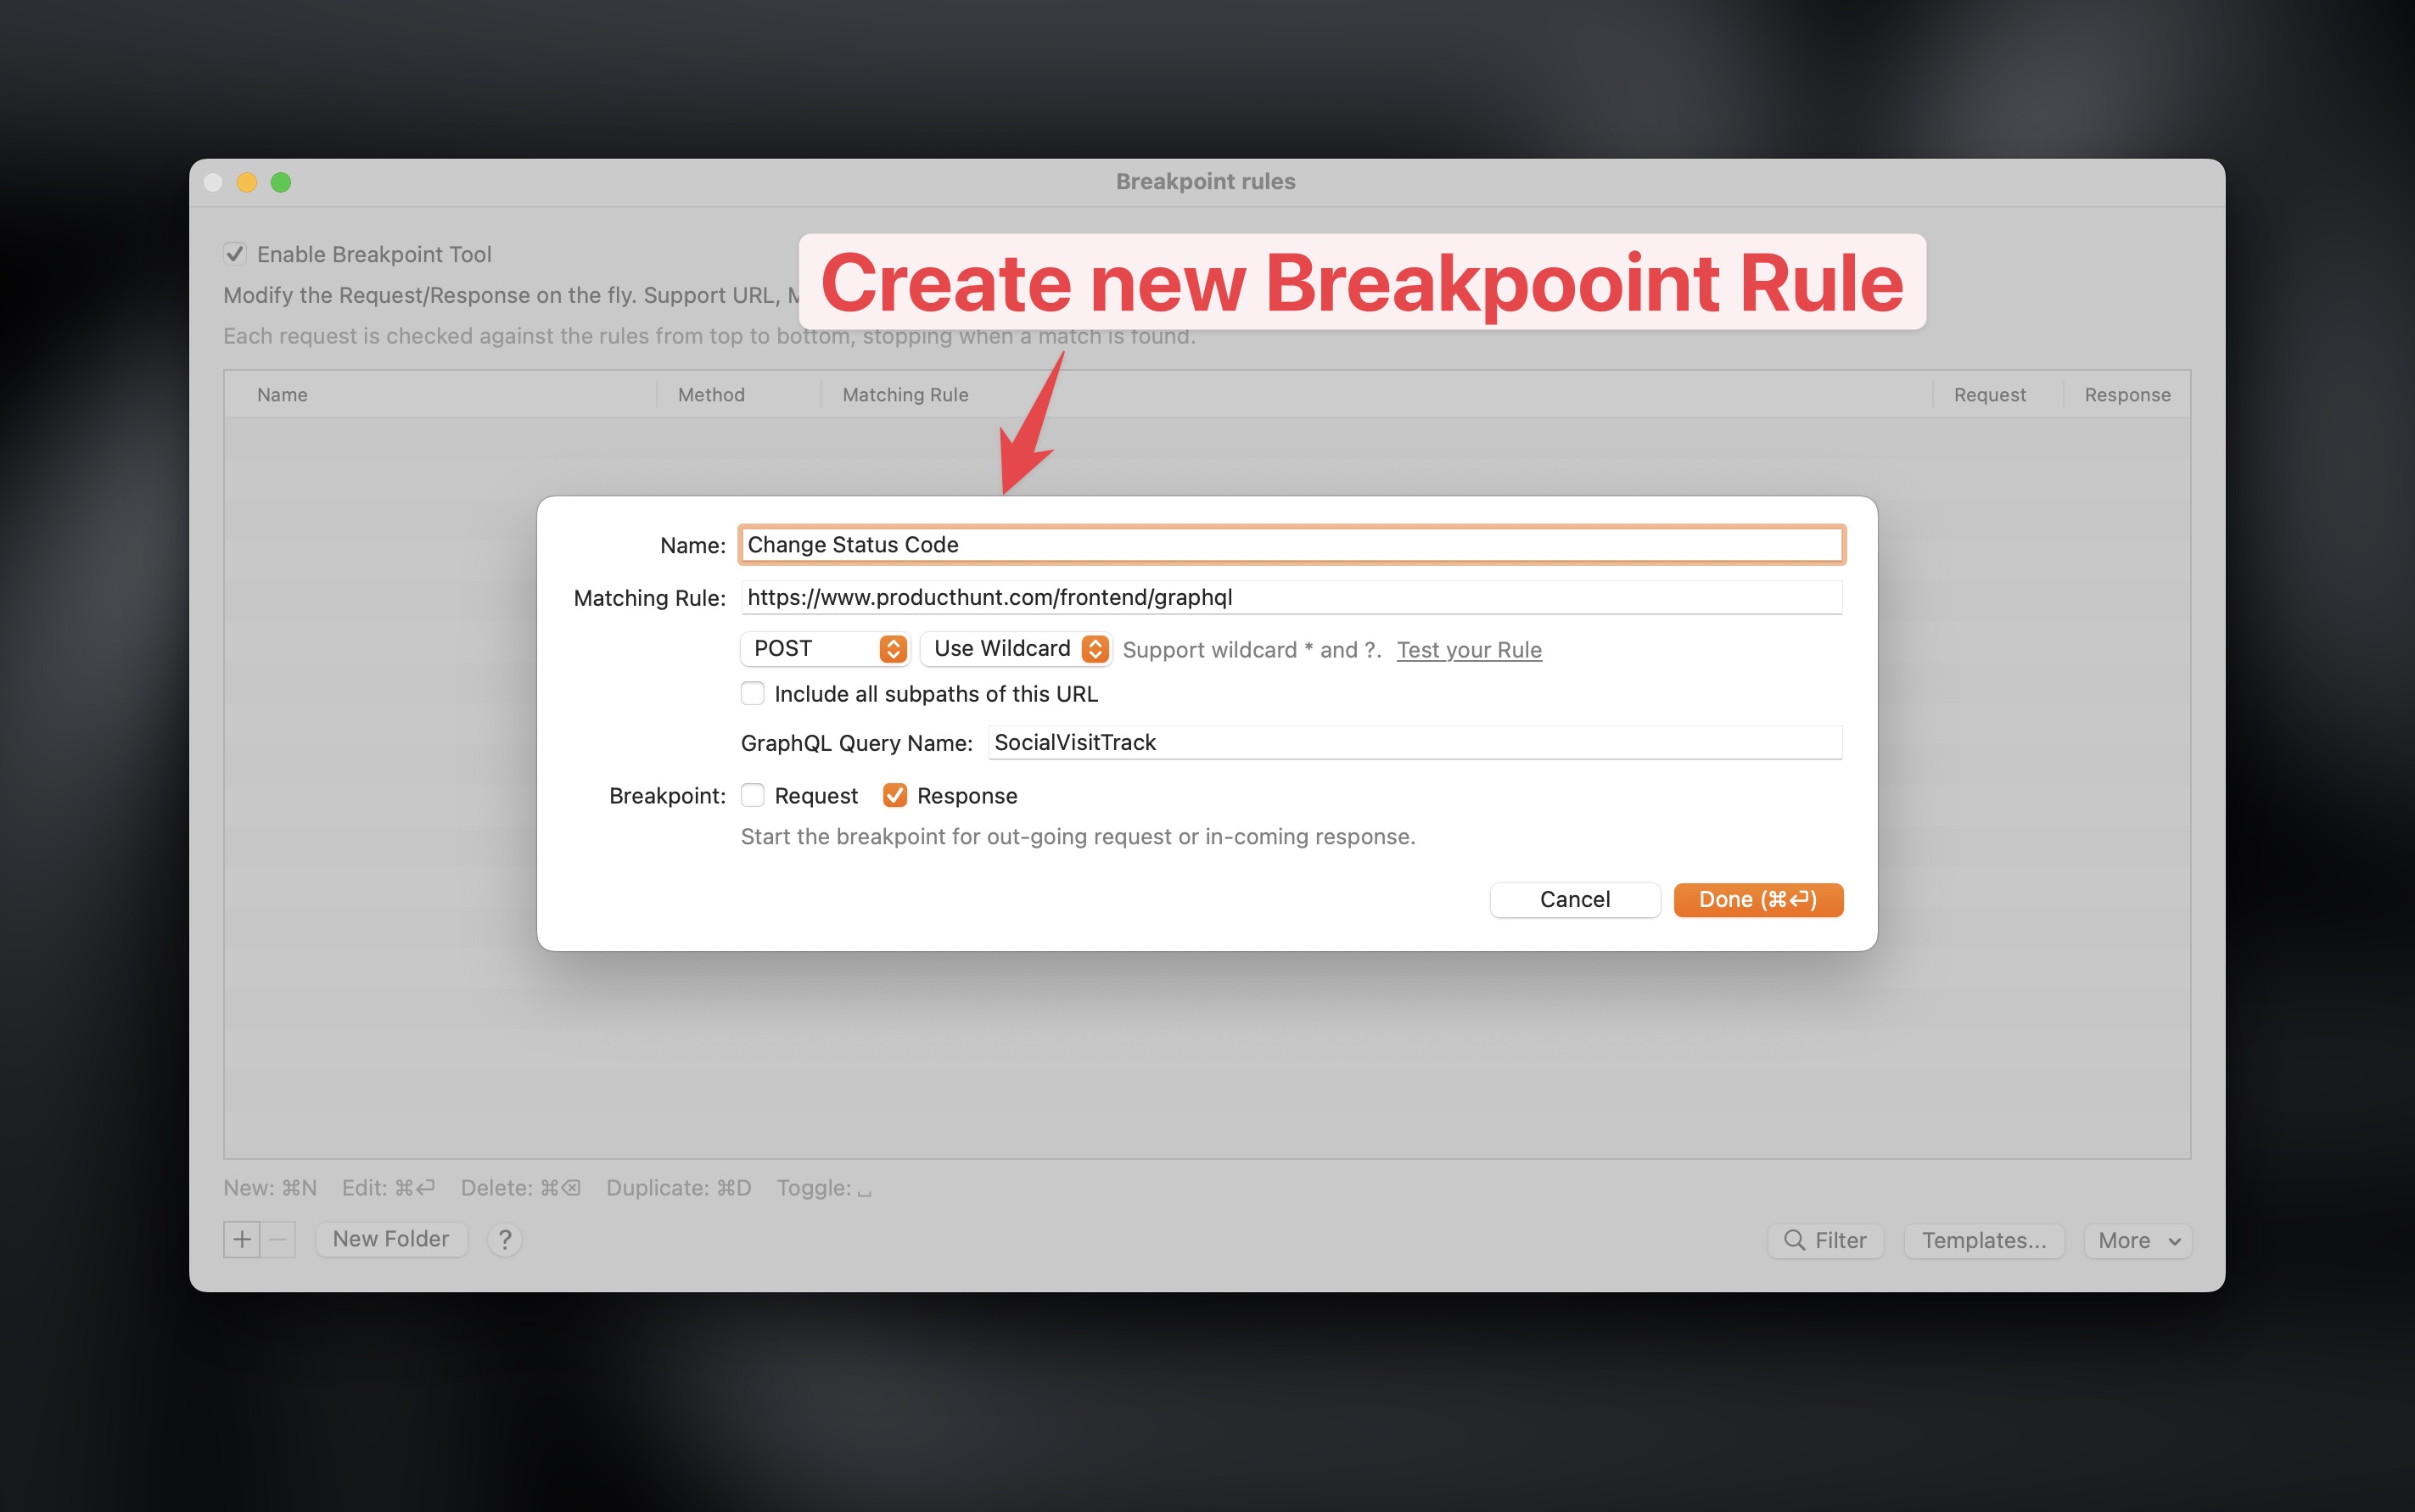
- Re-send the request again -> Proxyman will break at the breakpoint -> You can modify the request and response on the fly, such as modify the request body, response body, status code, etc.
and more
- You can also use other tools, such as Repeat, Edit & Repeat, Map Remote, etc.
- Please refer to the Proxyman Documentation for more information.
10. Where to Go From Here?
This blog only covers the basic features of Proxyman and how to capture HTTP(s) traffic from your macOS devices.
If you want to capture HTTPS from:
- iOS Devices -> Please refer to the Proxyman iOS Documentation
- iOS Simulators -> Please refer to the Proxyman iOS Simulators Documentation
- Android Devices -> Please refer to the Proxyman Android Documentation
- Android Emulators -> Please refer to the Proxyman Android Emulators Documentation
- NodeJS, Python, Ruby, PHP, etc. -> Please refer to the Proxyman HTTP/HTTPS Documentation
Proxyman is a high-performance macOS app, which enables developers to capture and inspect HTTP(s) traffic from apps and domains on iOS devices, iOS Simulators, and Android devices.
Get it at https://proxyman.com/