Hidden features from Proxyman (Part 1)
This mini-blog will show you a collection of hidden features that might significantly boost your productivity.
Diplay Response Header as a Column.
In some scenarios, we would like to track down one of the Header Values. The only solution is that we have to click on the Request and Find it in the Header Tab. Proxyman facilitates it by introducing the "Custom Header Column". It allows us to define a Column by a Header Key of the Request or Response.
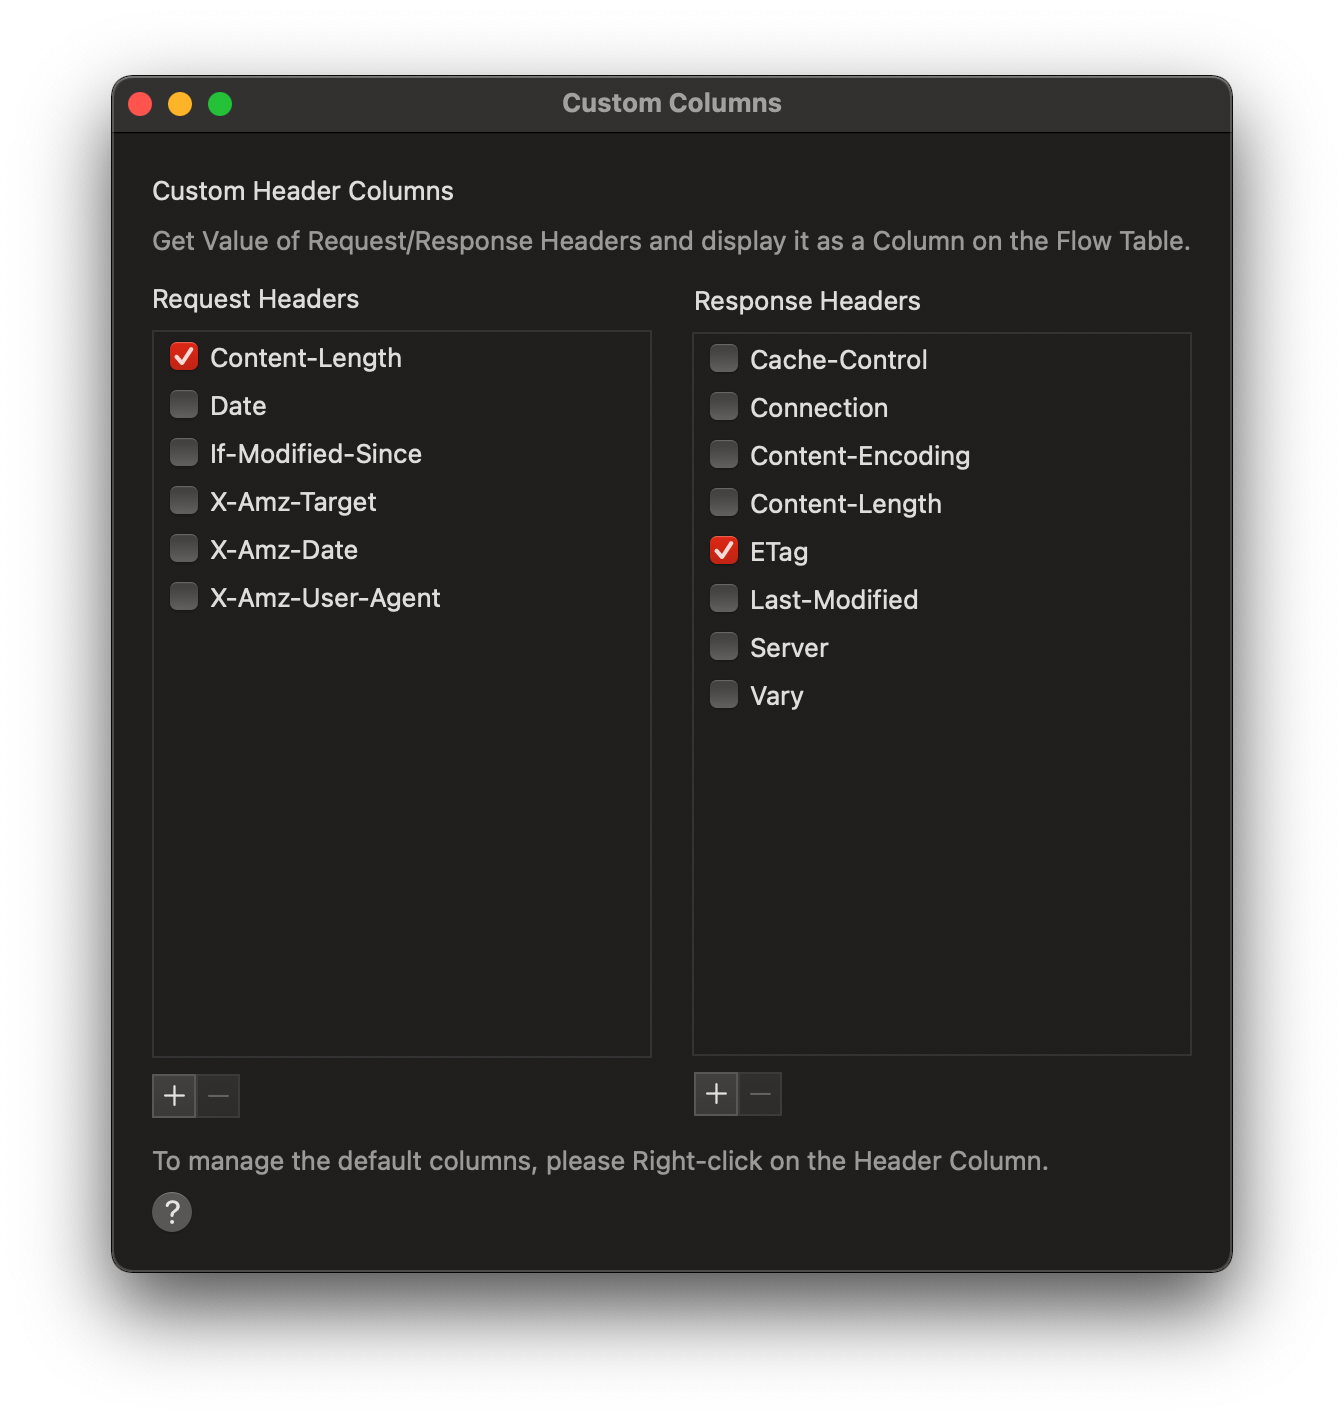
To illustrate, let assume that we'd like to inspect the Content-Length of the Request Body and the E-Tag Value from the Response.
- Right Click on the Column Header -> Request Header -> Manager Header Column.
- Select Content-Type on the Request Panel and E-Tag on the Response Panel
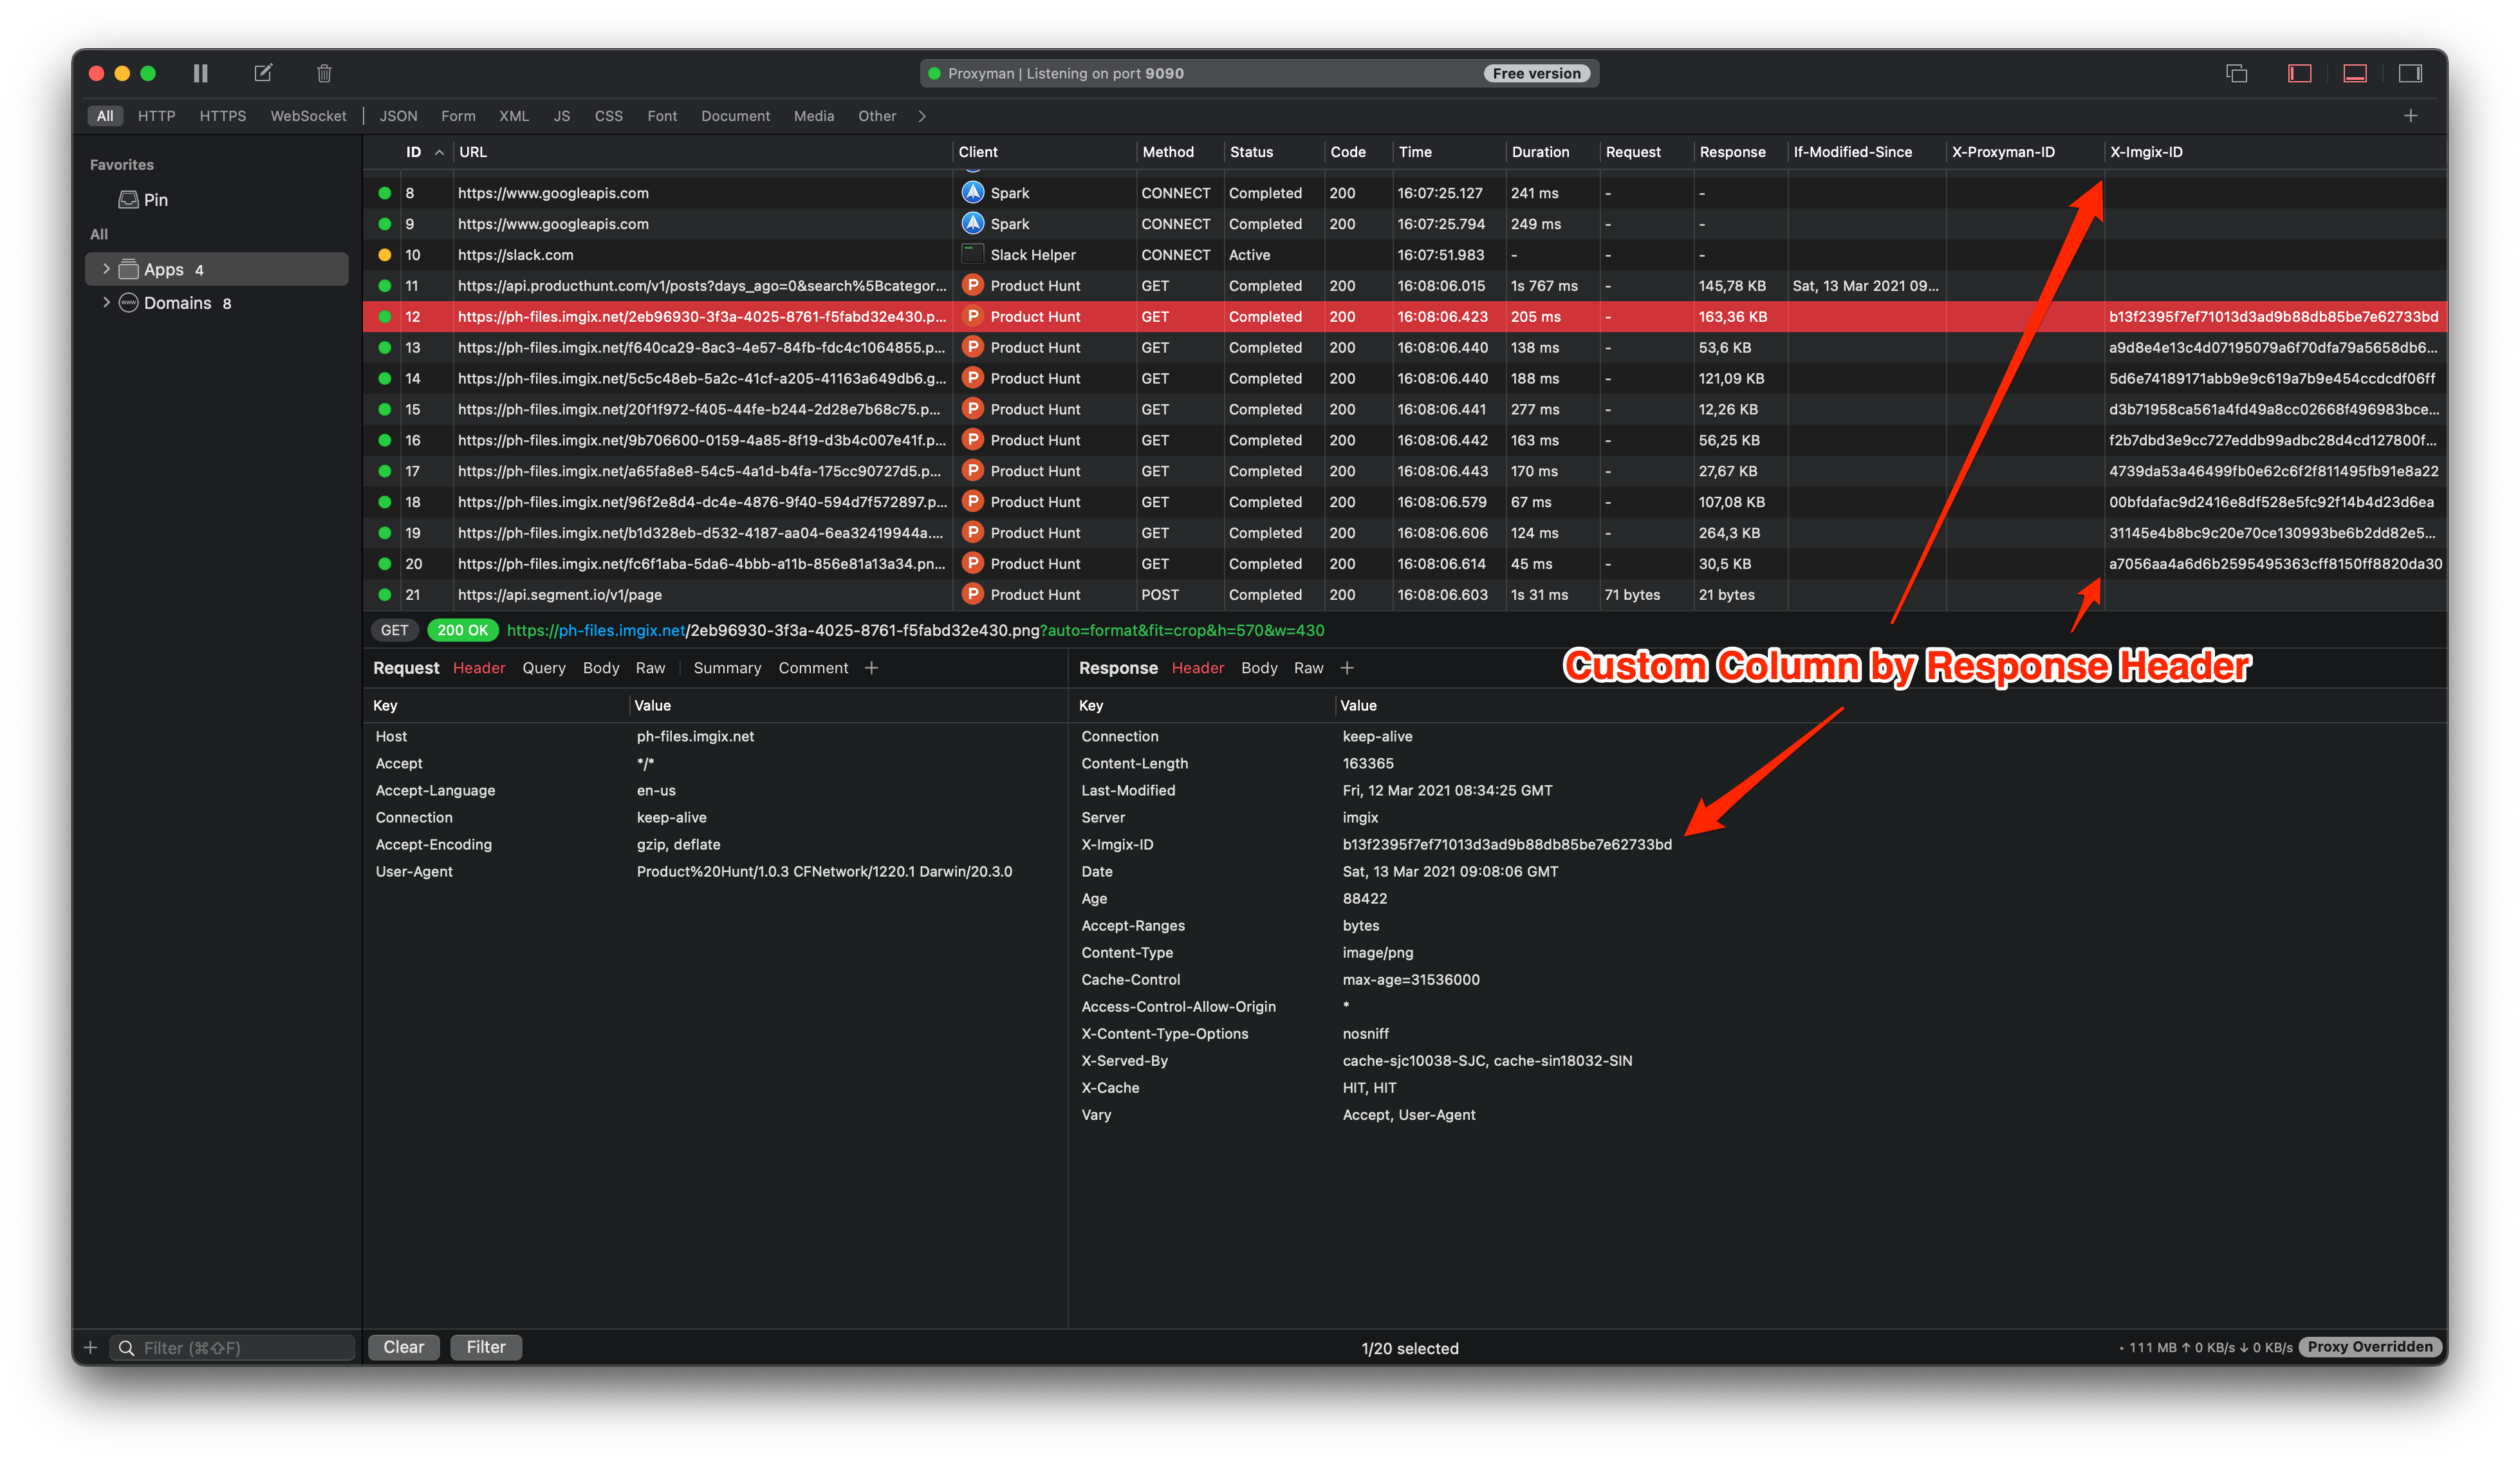
- These columns will be displayed at the end of the main table view.
From now, you can reorder the position (By dragging the Column) or resize its width.
We can also add a new custom Column by Clicking on the Add button of the Manager Header Column Window.
Combine multiple filters
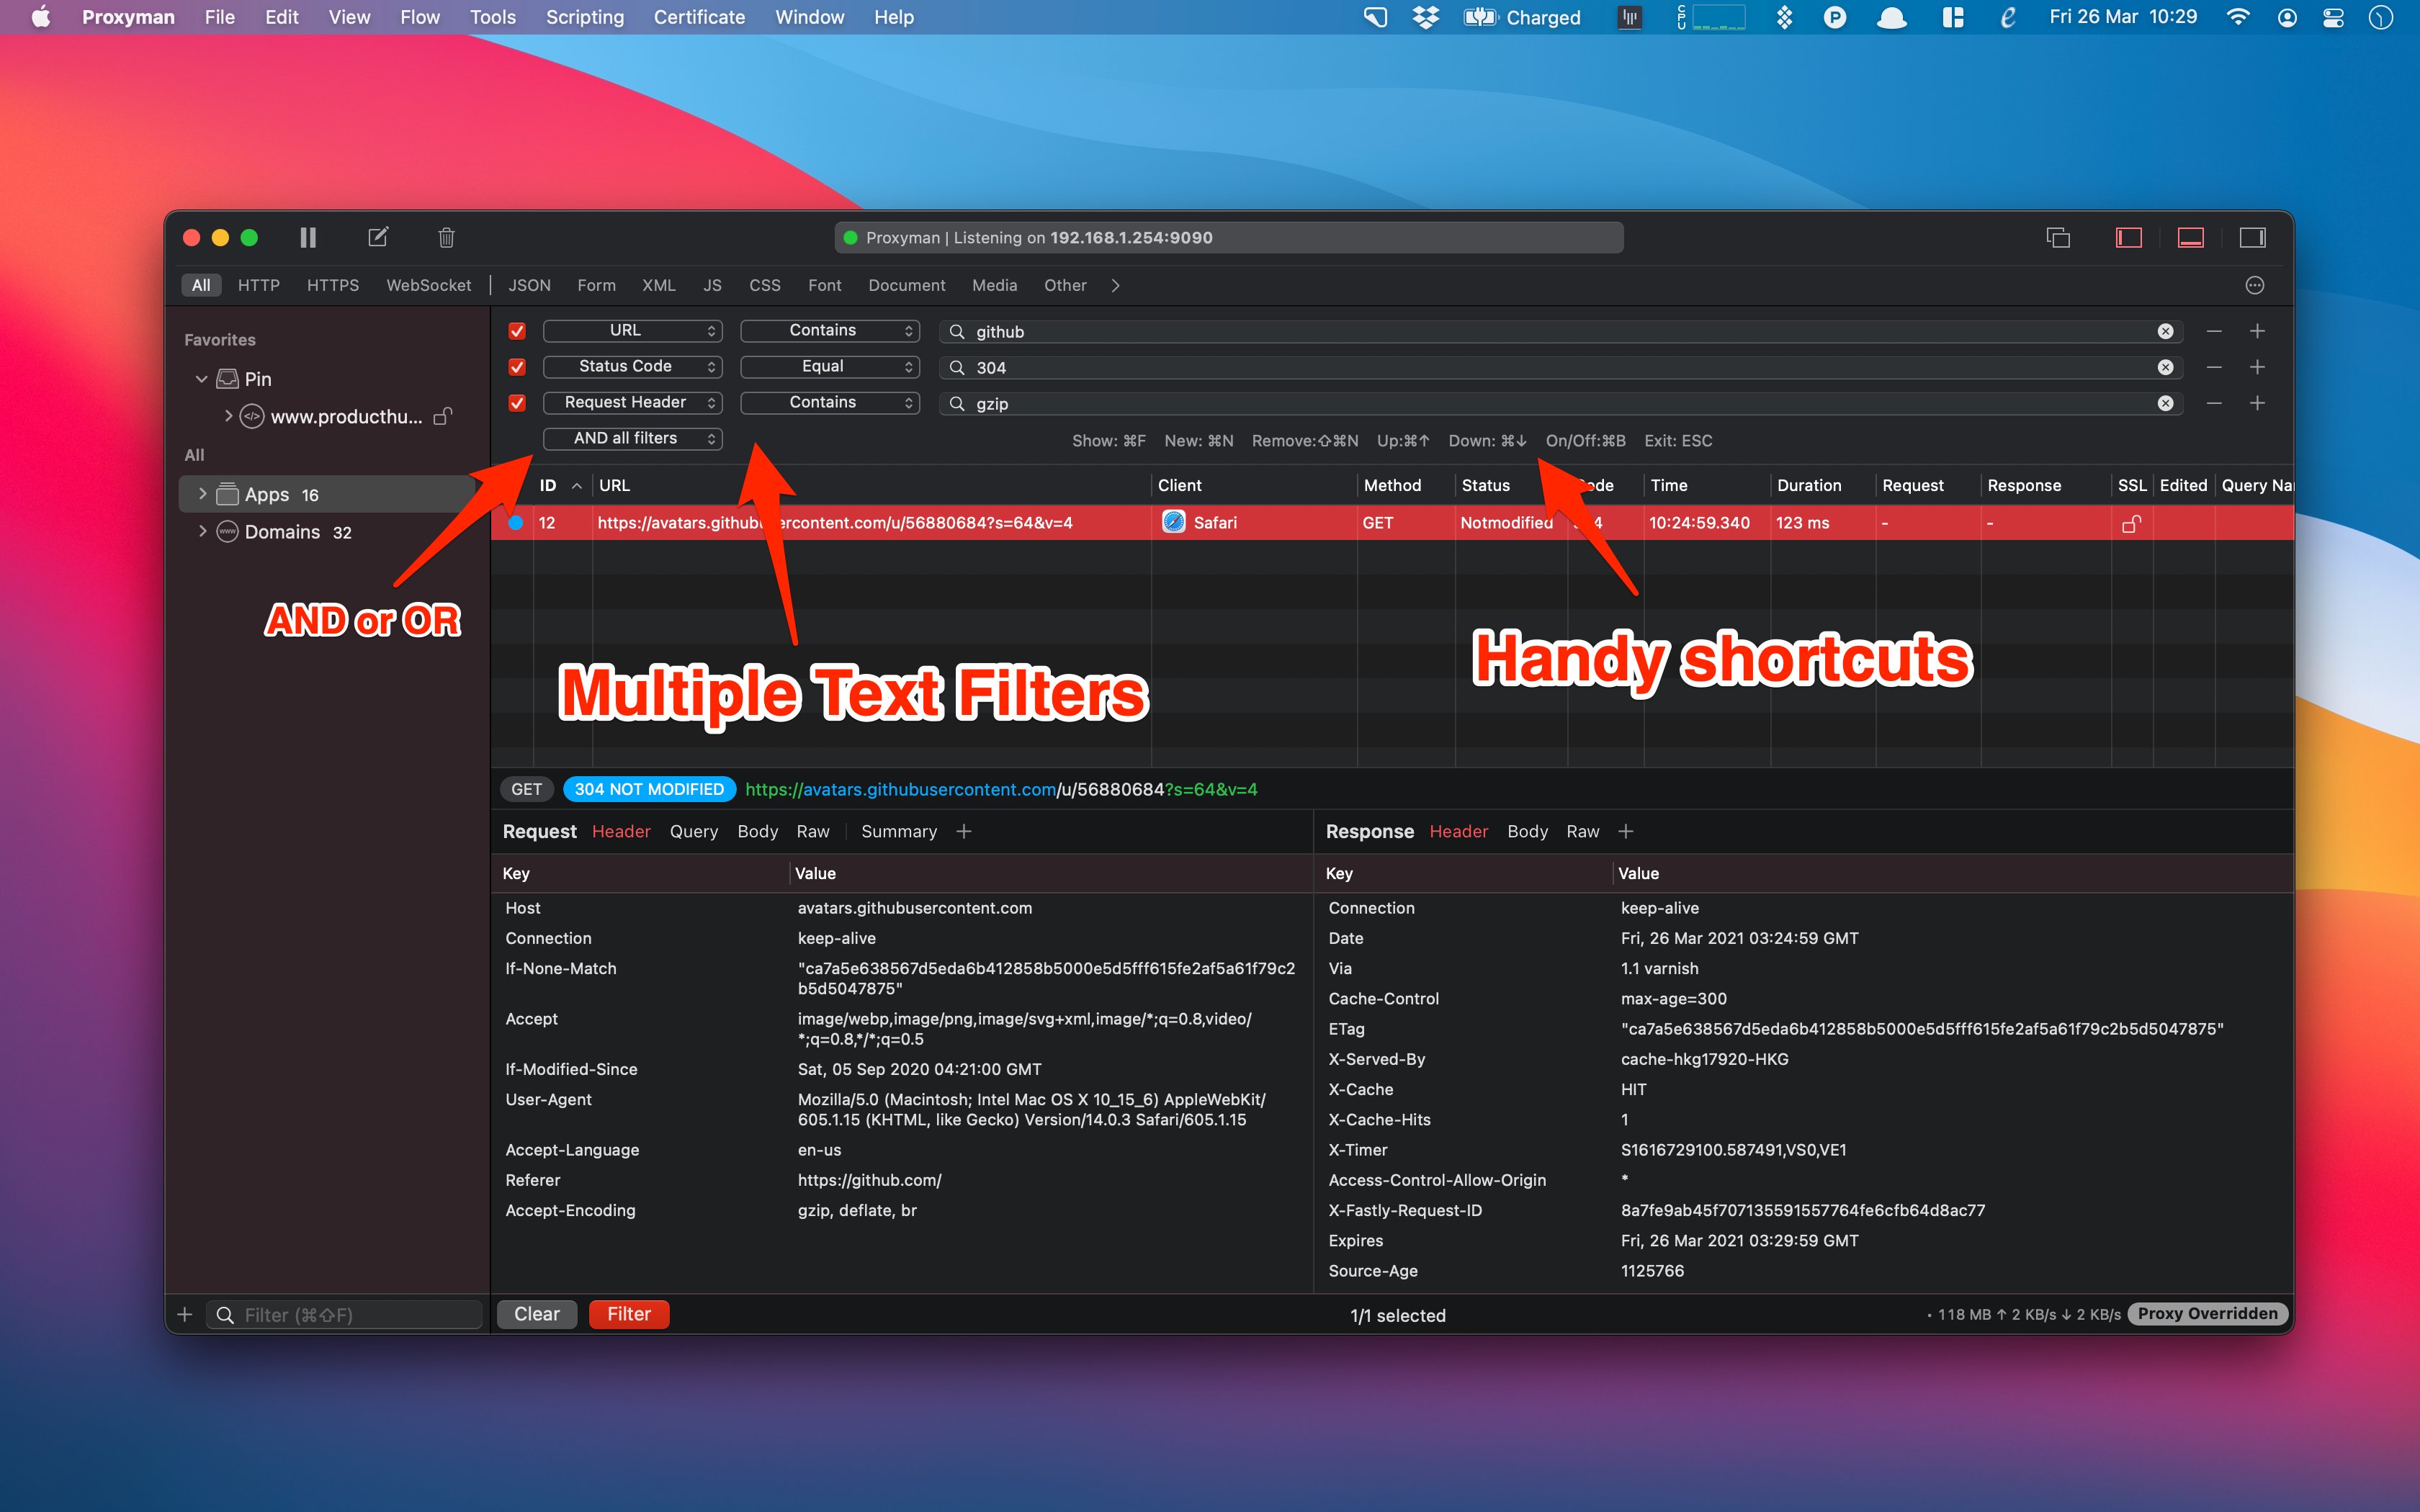
It's possible to define multiple criteria when searching your request by using Multiple Filter. It enables developers to narrow down the result and be able to find exactly Request/Response with given criteria.
We can search by:
- All, URL, Header Request, Header Value, Query, Status Code, Body, Request Method, Comment, and Color...
- Equal, Not Equal, Contain, Not Contains, Start With, End With, or Regex.
Proxyman also provides many shortcuts that you can interact with the filter without leaving your keyboard.
- CMD + F: Open the Filter Bar.
- CMD + N: Create new filter.
- SHIFT + CMD + N: Remove the current filter.
- CMD + Up/Down arrow: Move to next/previous filter text field.
Mock Response with Map Local
When working as a team, we often wait for the Backend Team to provide the App APIs. By using Proxyman Map Local, we can define a Mock API with a given Response. It significantly boosts team productivity since we can work around the blocker.
To define a Mock API:
- Open Tools -> Map Local
- CMD + N to create new Rule
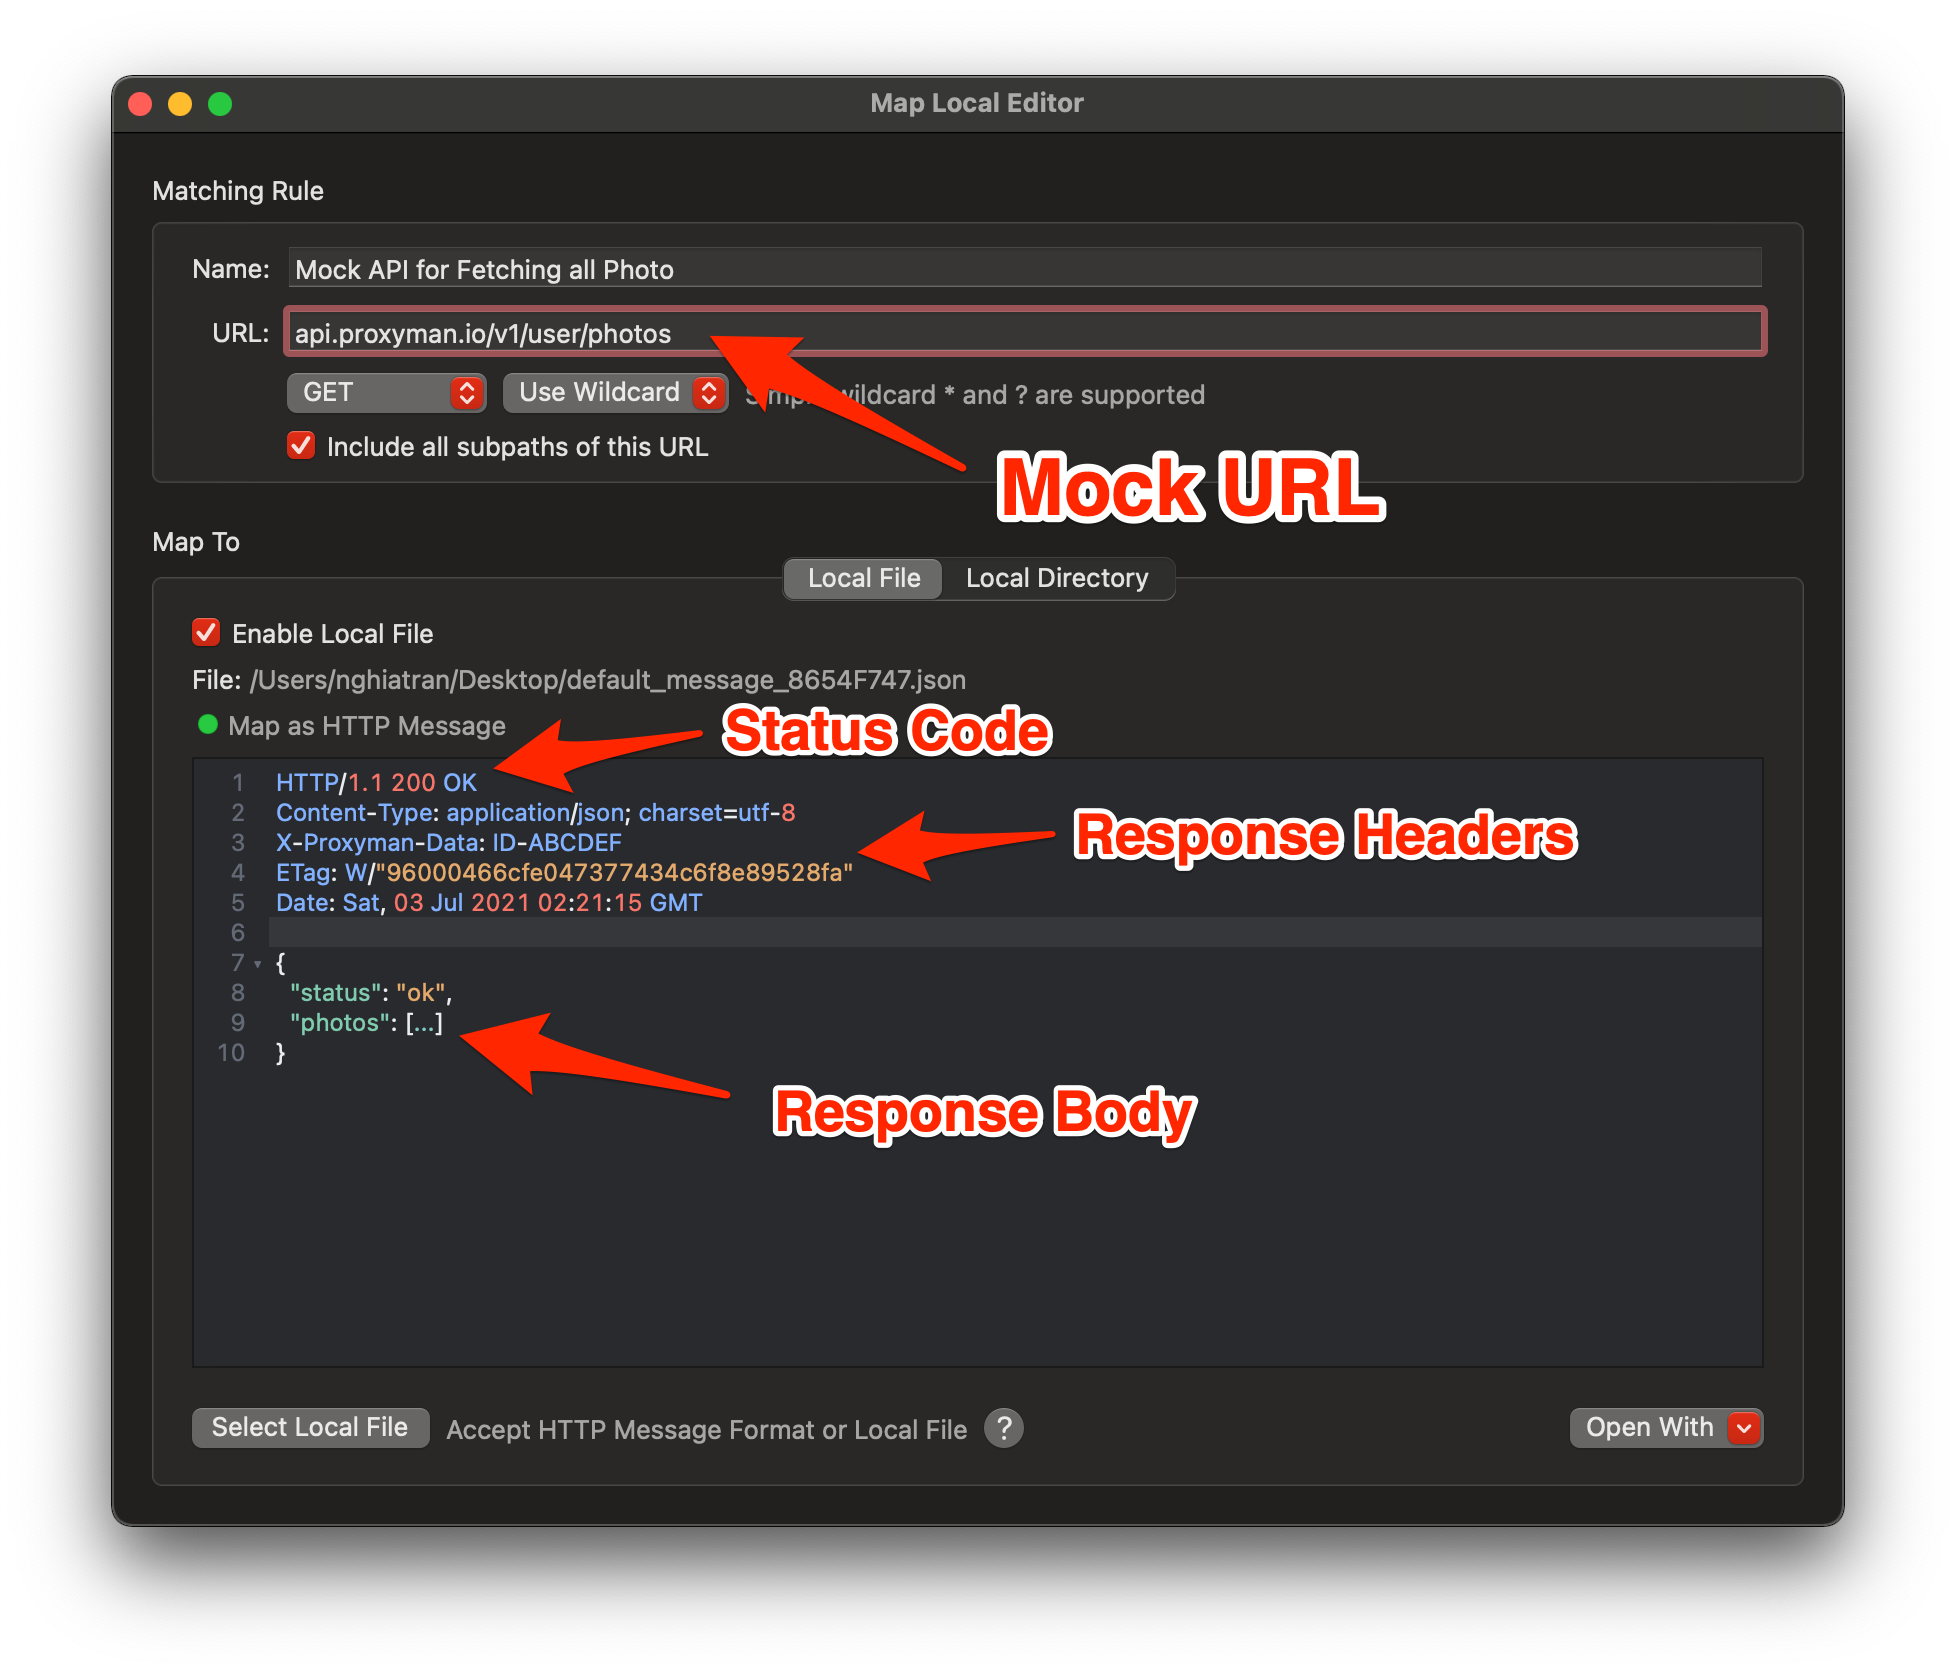
- Enter the Mock URL: It should be a full URL that you'd like to mock
- In the Editor, we can define a Response. You can modify:
- Status Code, Response Headers, and the Response Body.
You can either select a local file by clicking on the Select Local File button.
Quickly share traffic log
Proxyman provides multiple ways to quickly share Request/Response log to your colleagues:
- Proxyman Log (Recommended): It's a build-in log file, which stores all Request/Response data. We highly recommend using this format since it can persist all Request/Response metadata, includes the Client Icon, Timing, Comment, and Highlight Colors. However, ProxymanLog only is opened by the Proxyman app.
- HAR file: It's a convenient format that allows other apps to open, such as Charles Proxy, Fiddler, Google Chrome Dev Tools,...
- CSV: It allows
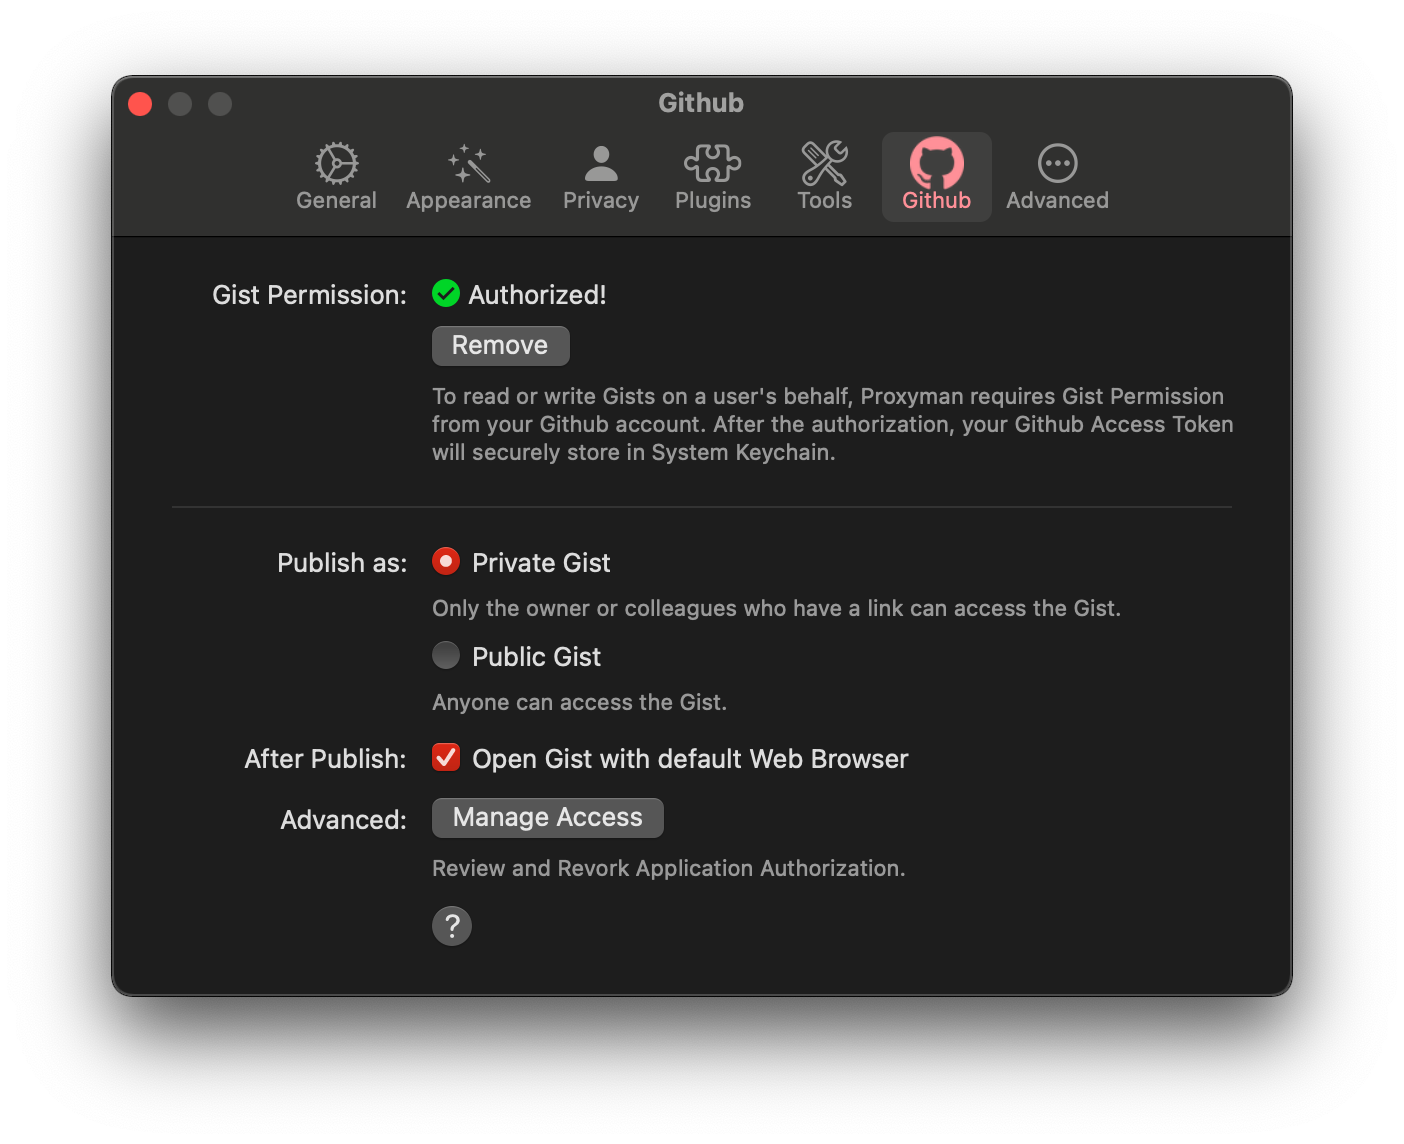
- Publish to Gist: A new way to instantly store your Request/Response to GitHub Gist. You can create a Public or Private Gist.
What's next
Proxyman has many hidden features which are waiting for you to discover. If you find it useful for your daily works, don't hesitate to share it with your team/colleagues ❤️.
Proxyman is a high-performance macOS app, which enables developers to capture network traffic on iOS device, iOS Simulator and Android devices.
Get it at https://proxyman.com